
Everything You Need to Know About Using Google Analytics 4 (GA4) to Grow Your Substack Newsletter
Discover how to combine Google Analytics 4 (GA4) with AI tools to analyze traffic, boost engagement, and scale your Substack newsletter.

Access your FREE Solopreneur Success Hub
Your subscribers-only comprehensive command center for building and scaling a successful one-person business.
🚀 Save 20+ hours per week
🛠 Get plug-and-play business systems
📈 Focus on growth instead of busywork
Just subscribe to my newsletter (Solopreneur Code) and unlock the ultimate resource hub.
More information about the Hub here.

You’re growing your Substack.
You’re putting out quality content.
But how do you really know what’s working?
If you’re relying only on Substack’s native analytics, you’re missing a big piece of the puzzle.
That’s where Google Analytics 4 (GA4) comes in.
In this detailed post, I’ll walk you through everything, from setup to strategy, so you can stop guessing and start growing with real data.
Table of Contents
Enhance Your Substack Growth: How to Use ChatGPT to Analyze GA4 Data (ONLY for PAID Subscribers)
🧠 Detailed Prompt for: General Understanding of GA4 Metrics with ChatGPT
📊 Detailed Prompt for: Data Interpretation of GA4 Metrics with ChatGPT
🎯 Detailed Prompt for: Action Planning Based on GA4 Data with ChatGPT
📌 Detailed Prompt for: Content Strategy Based on GA4 Data with ChatGPT
1. What is Google Analytics, and Why Use It for Substack?
Google Analytics 4 (GA4) is a free analytics platform by Google that tracks how visitors interact with your website.
In this case, your Substack.
Substack already gives you basic info like:
Email open rates
Subscriber growth
Basic audience demographics
Post views
But GA4 unlocks deeper, actionable insights like:
Where your readers come from (Twitter/X, SEO, Threads, LinkedIn, etc.)
How long they stay on your post pages
Which content gets clicked and shared
What devices they use
Which geographic areas your readers are from
Why it matters:
Knowing what drives traffic and how people engage helps you double down on what works — and ditch what doesn’t.
2. How to Connect GA4 to Your Substack
This is a one-time setup. No tech skills needed.
Here’s the breakdown:
Step 1: Create a GA4 Property
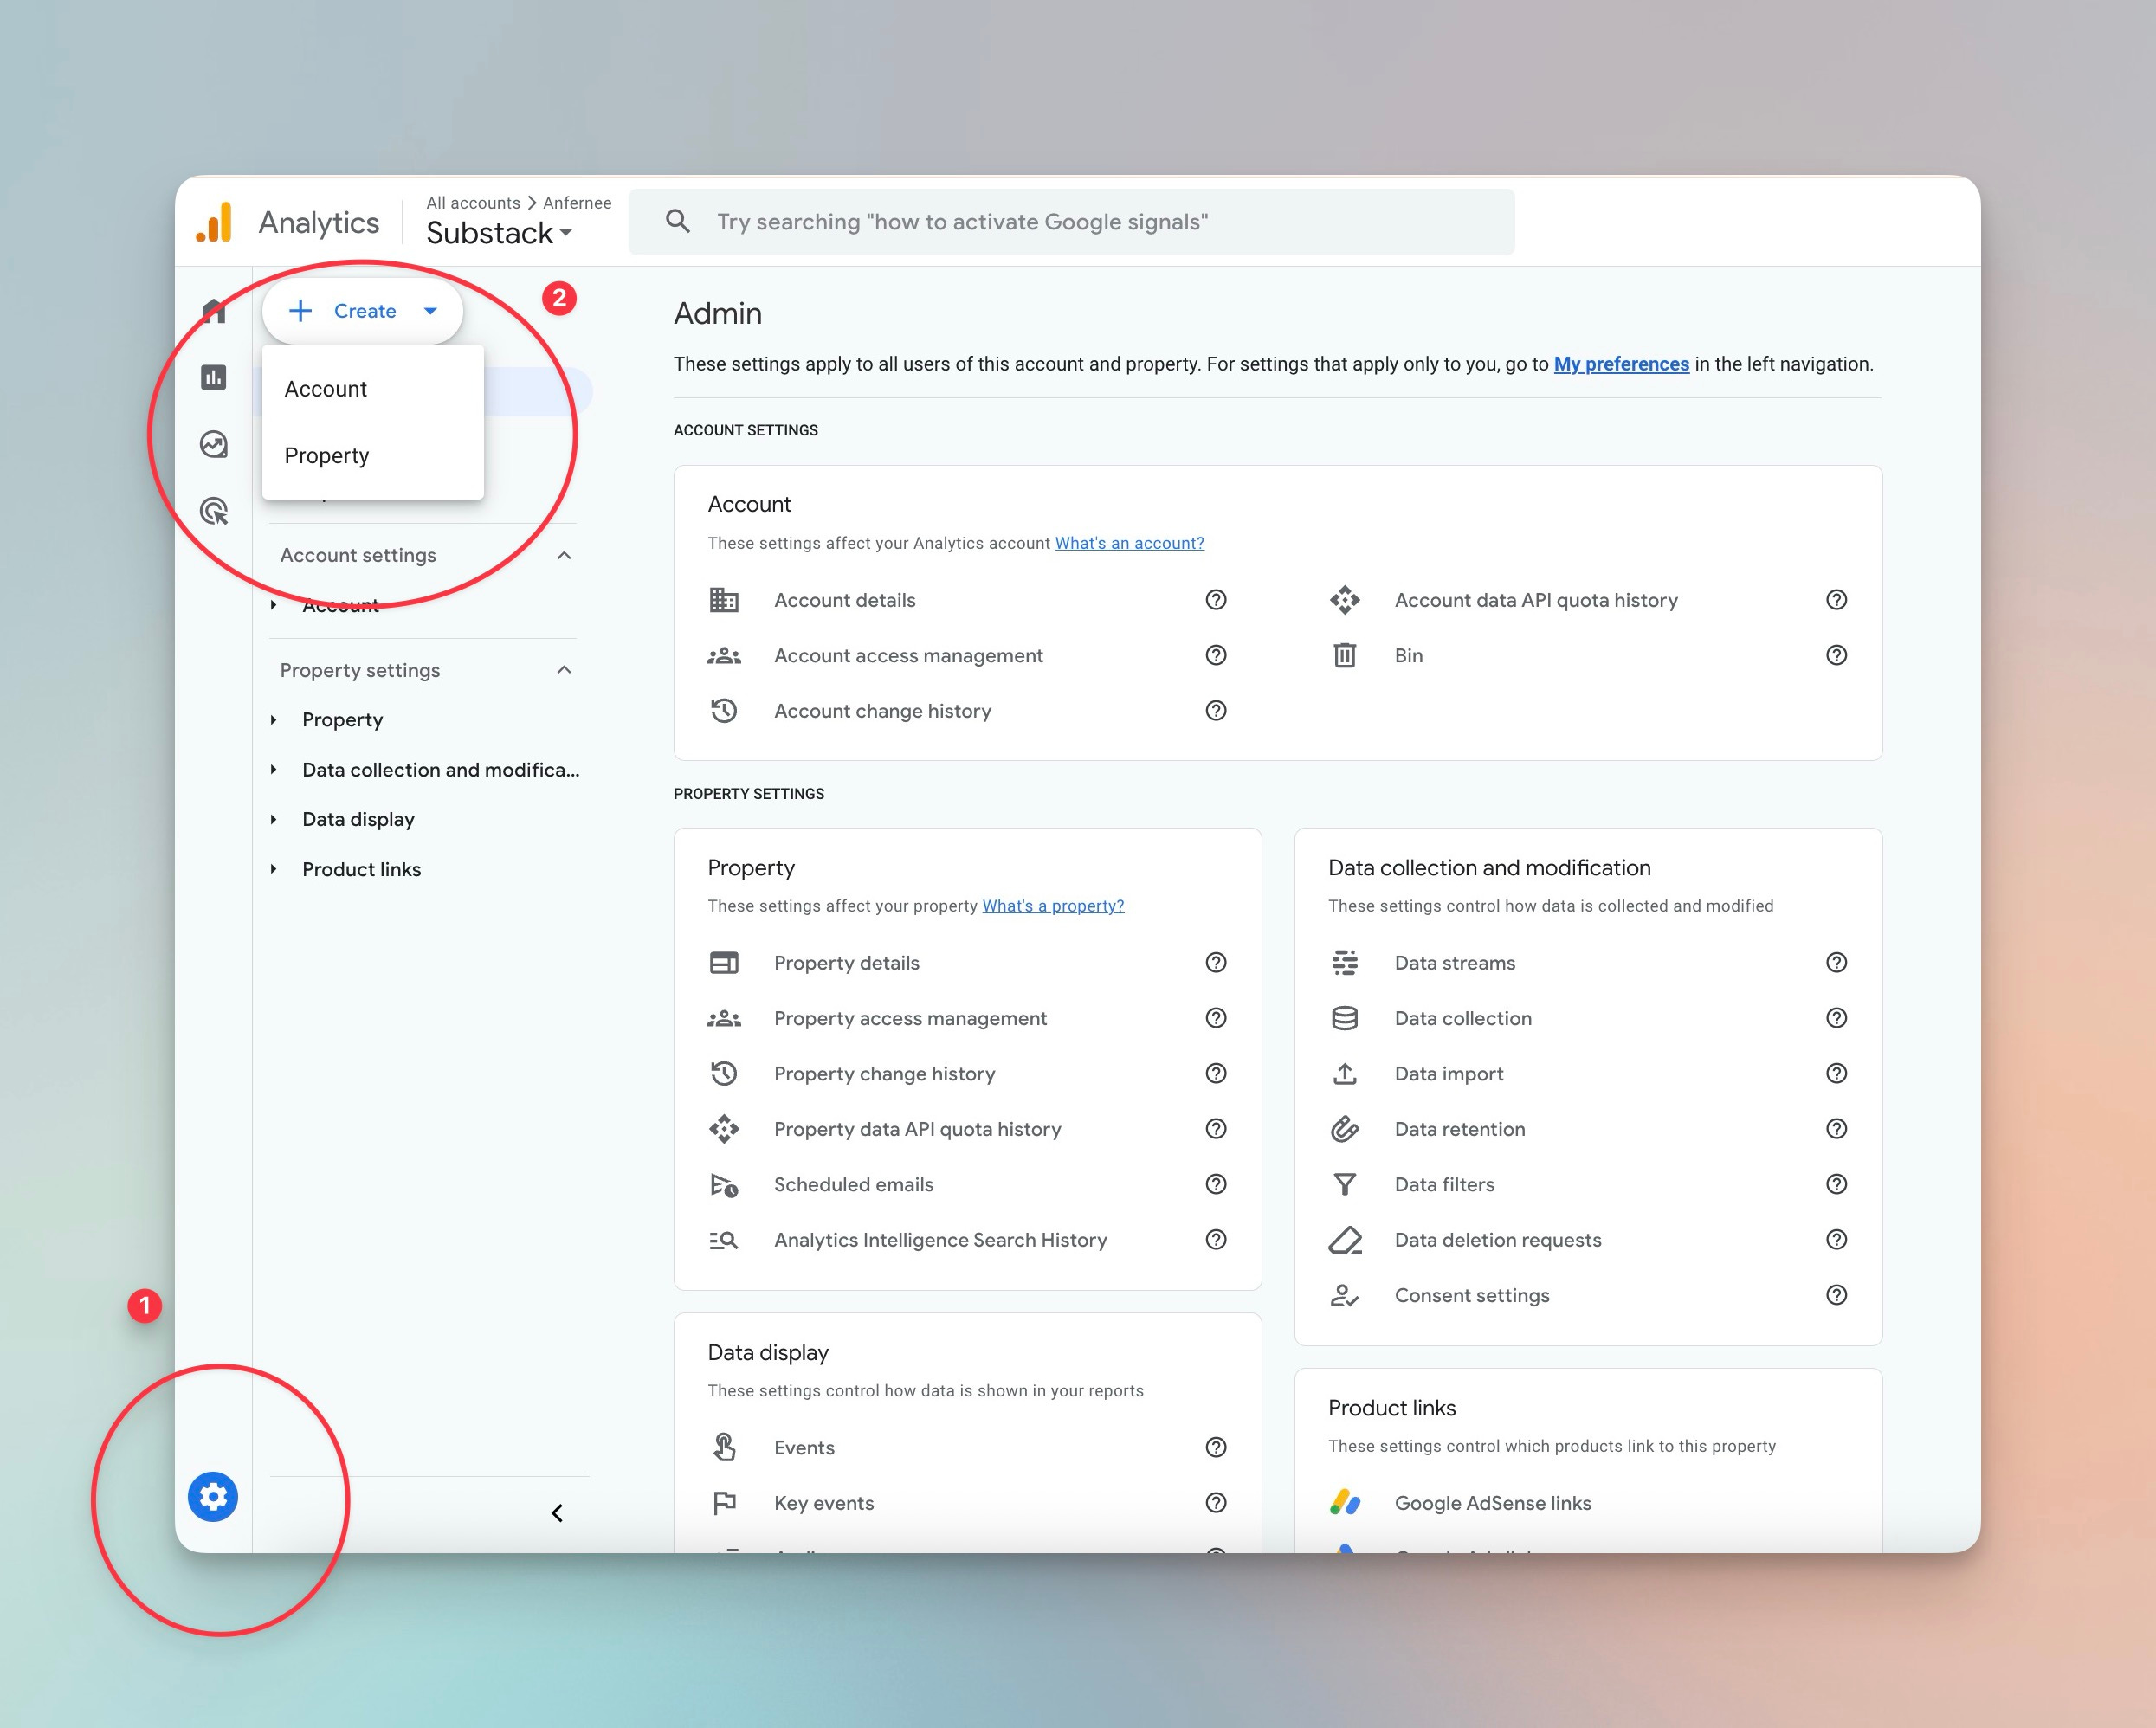
Go to Google Analytics
Click the Admin gear (bottom-left corner)
Under “Account,” click + Create Account (if you haven’t yet)
Under “Property,” click + Create Property
Fill in basic information for:
Property creation
Business details
Business objectives
Choose Web and enter your Substack URL (like yoursubstackname.substack.com)
Follow the prompts and click Create
Step 2: Grab the Measurement ID
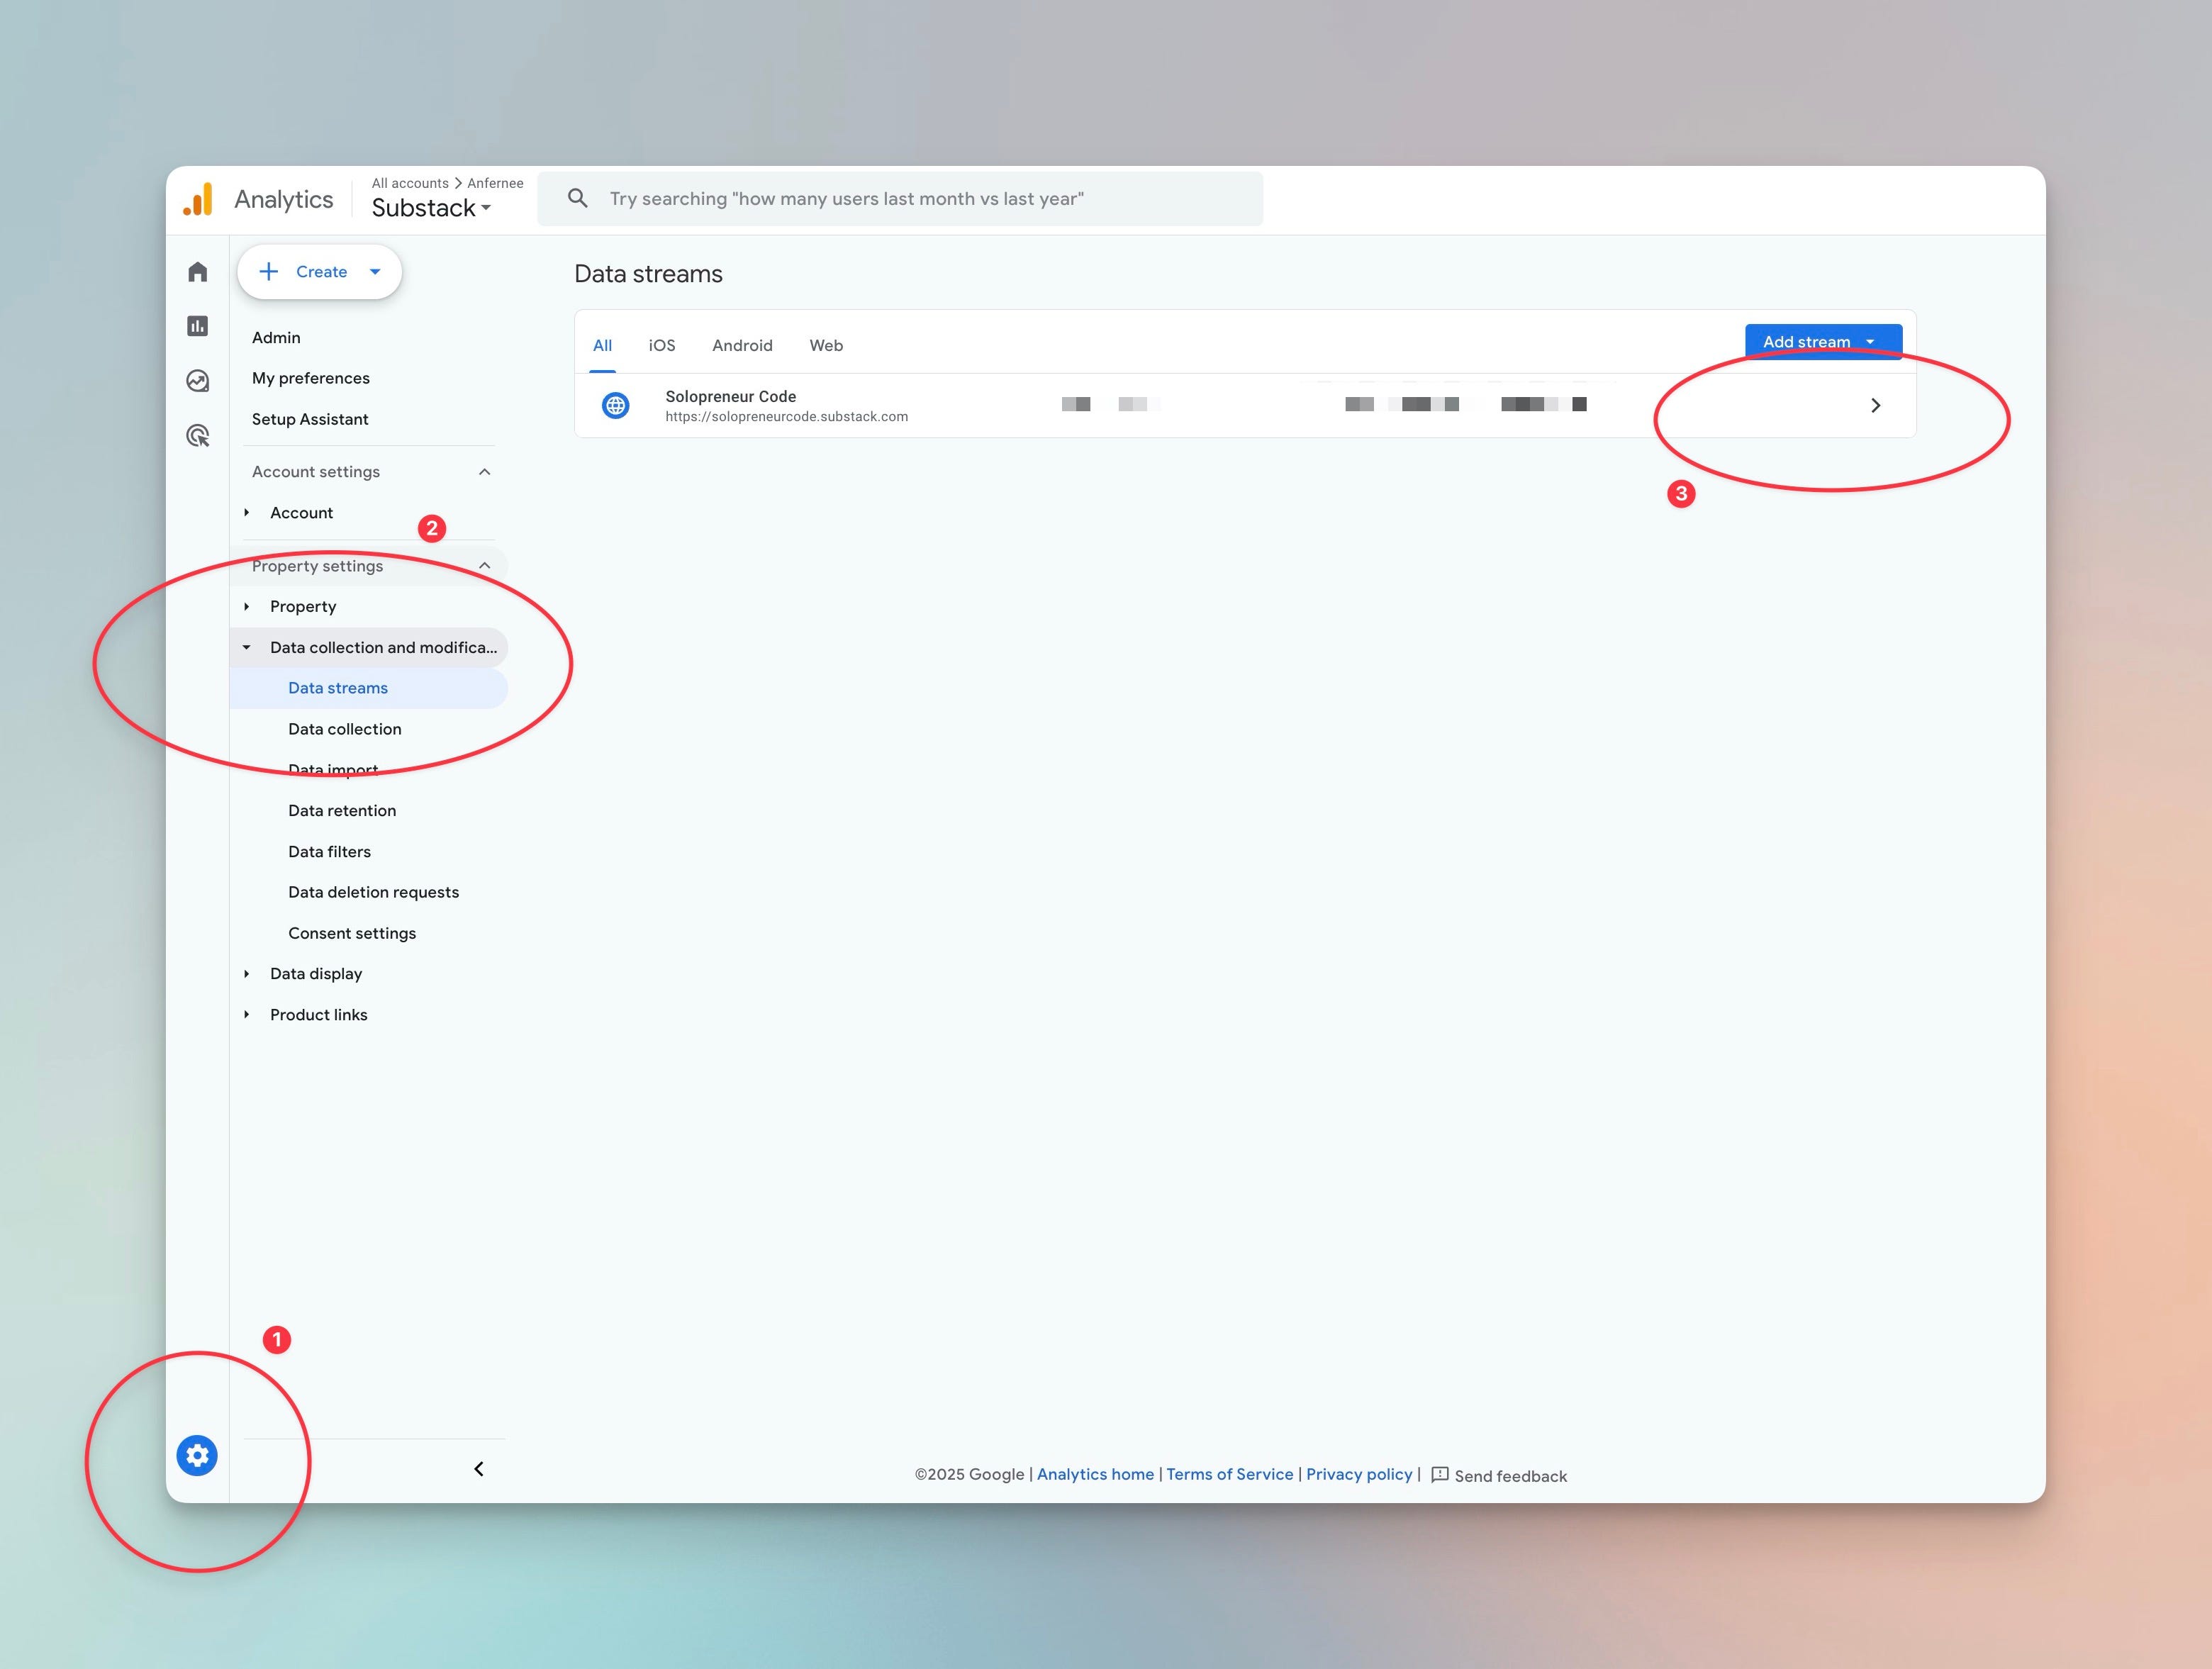
After setup, go to Admin > Data Streams
Click the Web stream you created
Copy the Measurement ID — it looks like: G-XXXXXXX
Step 3: Add to Substack
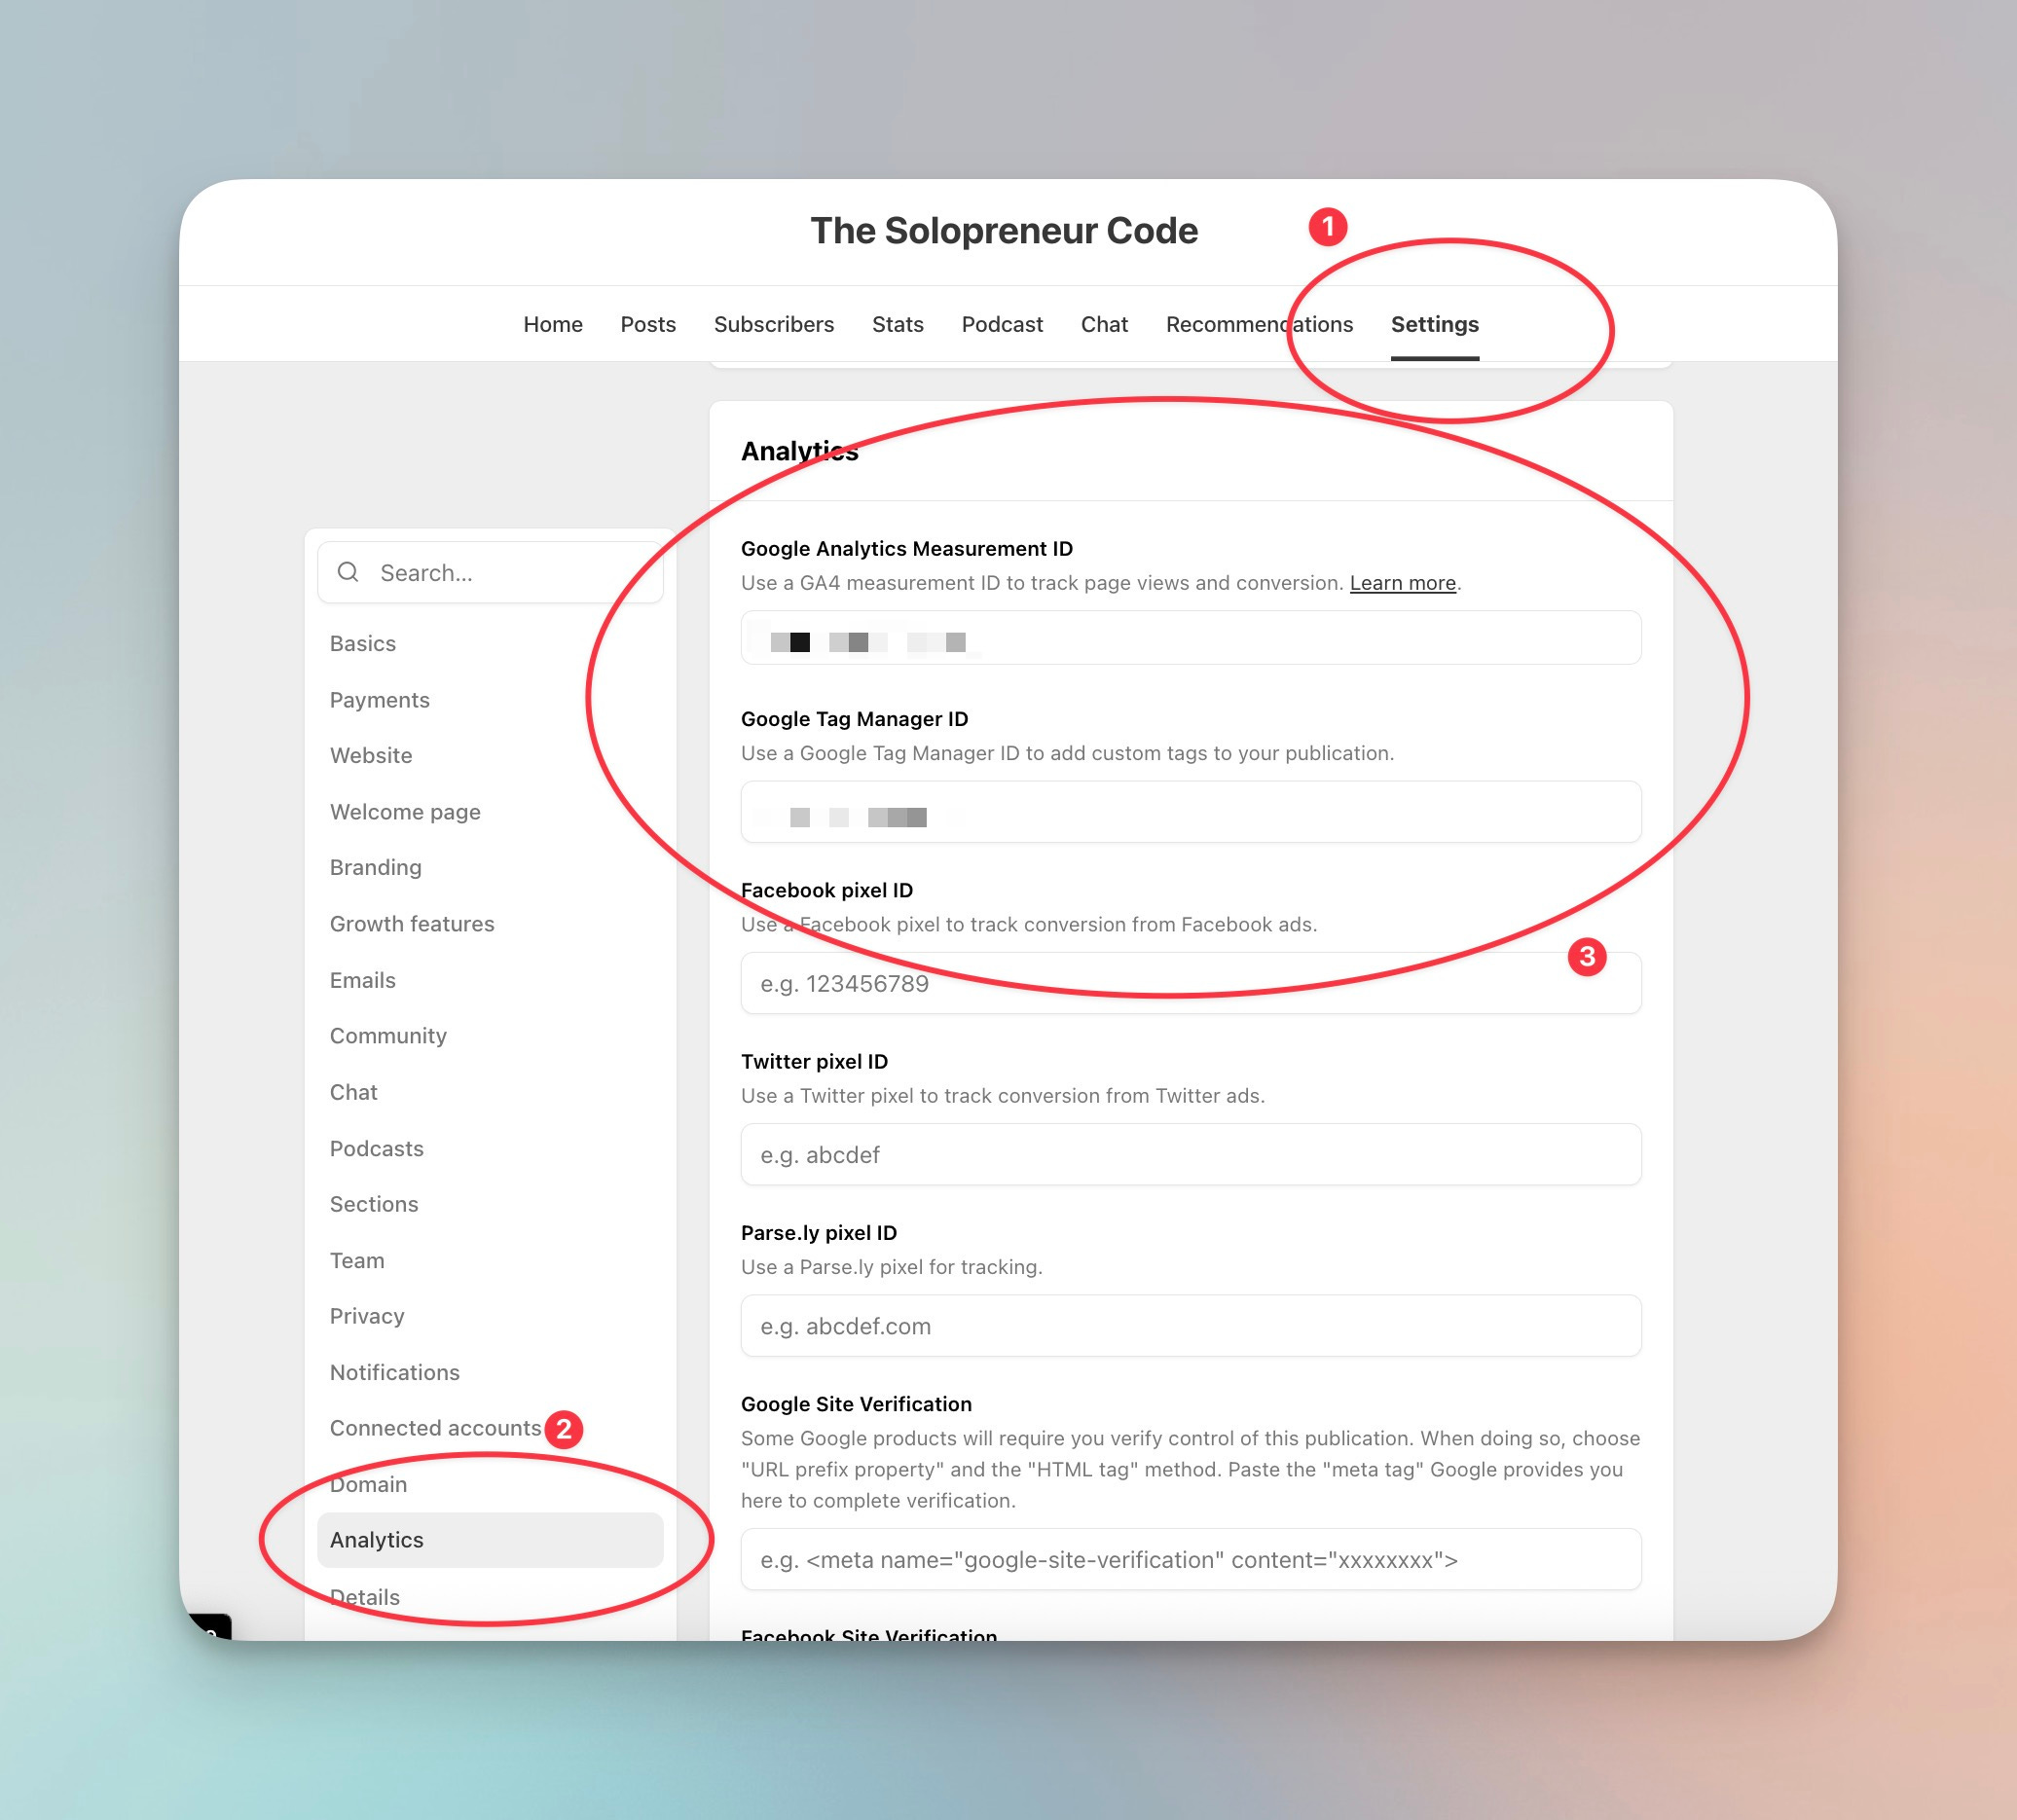
Log into Substack
Go to Settings > Analytics
Paste the GA4 Measurement ID into the Google Analytics Measurement ID
Hit Save
🎉 You’re done!
GA4 will now track pageviews and web-based actions.
⚠️ Heads up: GA4 won’t track posts opened in the user’s native email app or those opened in the native Substack app reader. More on that later.
3. Navigating GA4 Without the Headache
Yes, GA4 can look like a sci-fi futuristic supercomputer dashboard at first.
But don’t worry, you only need a few key areas to get real value:
Top Sections to Know
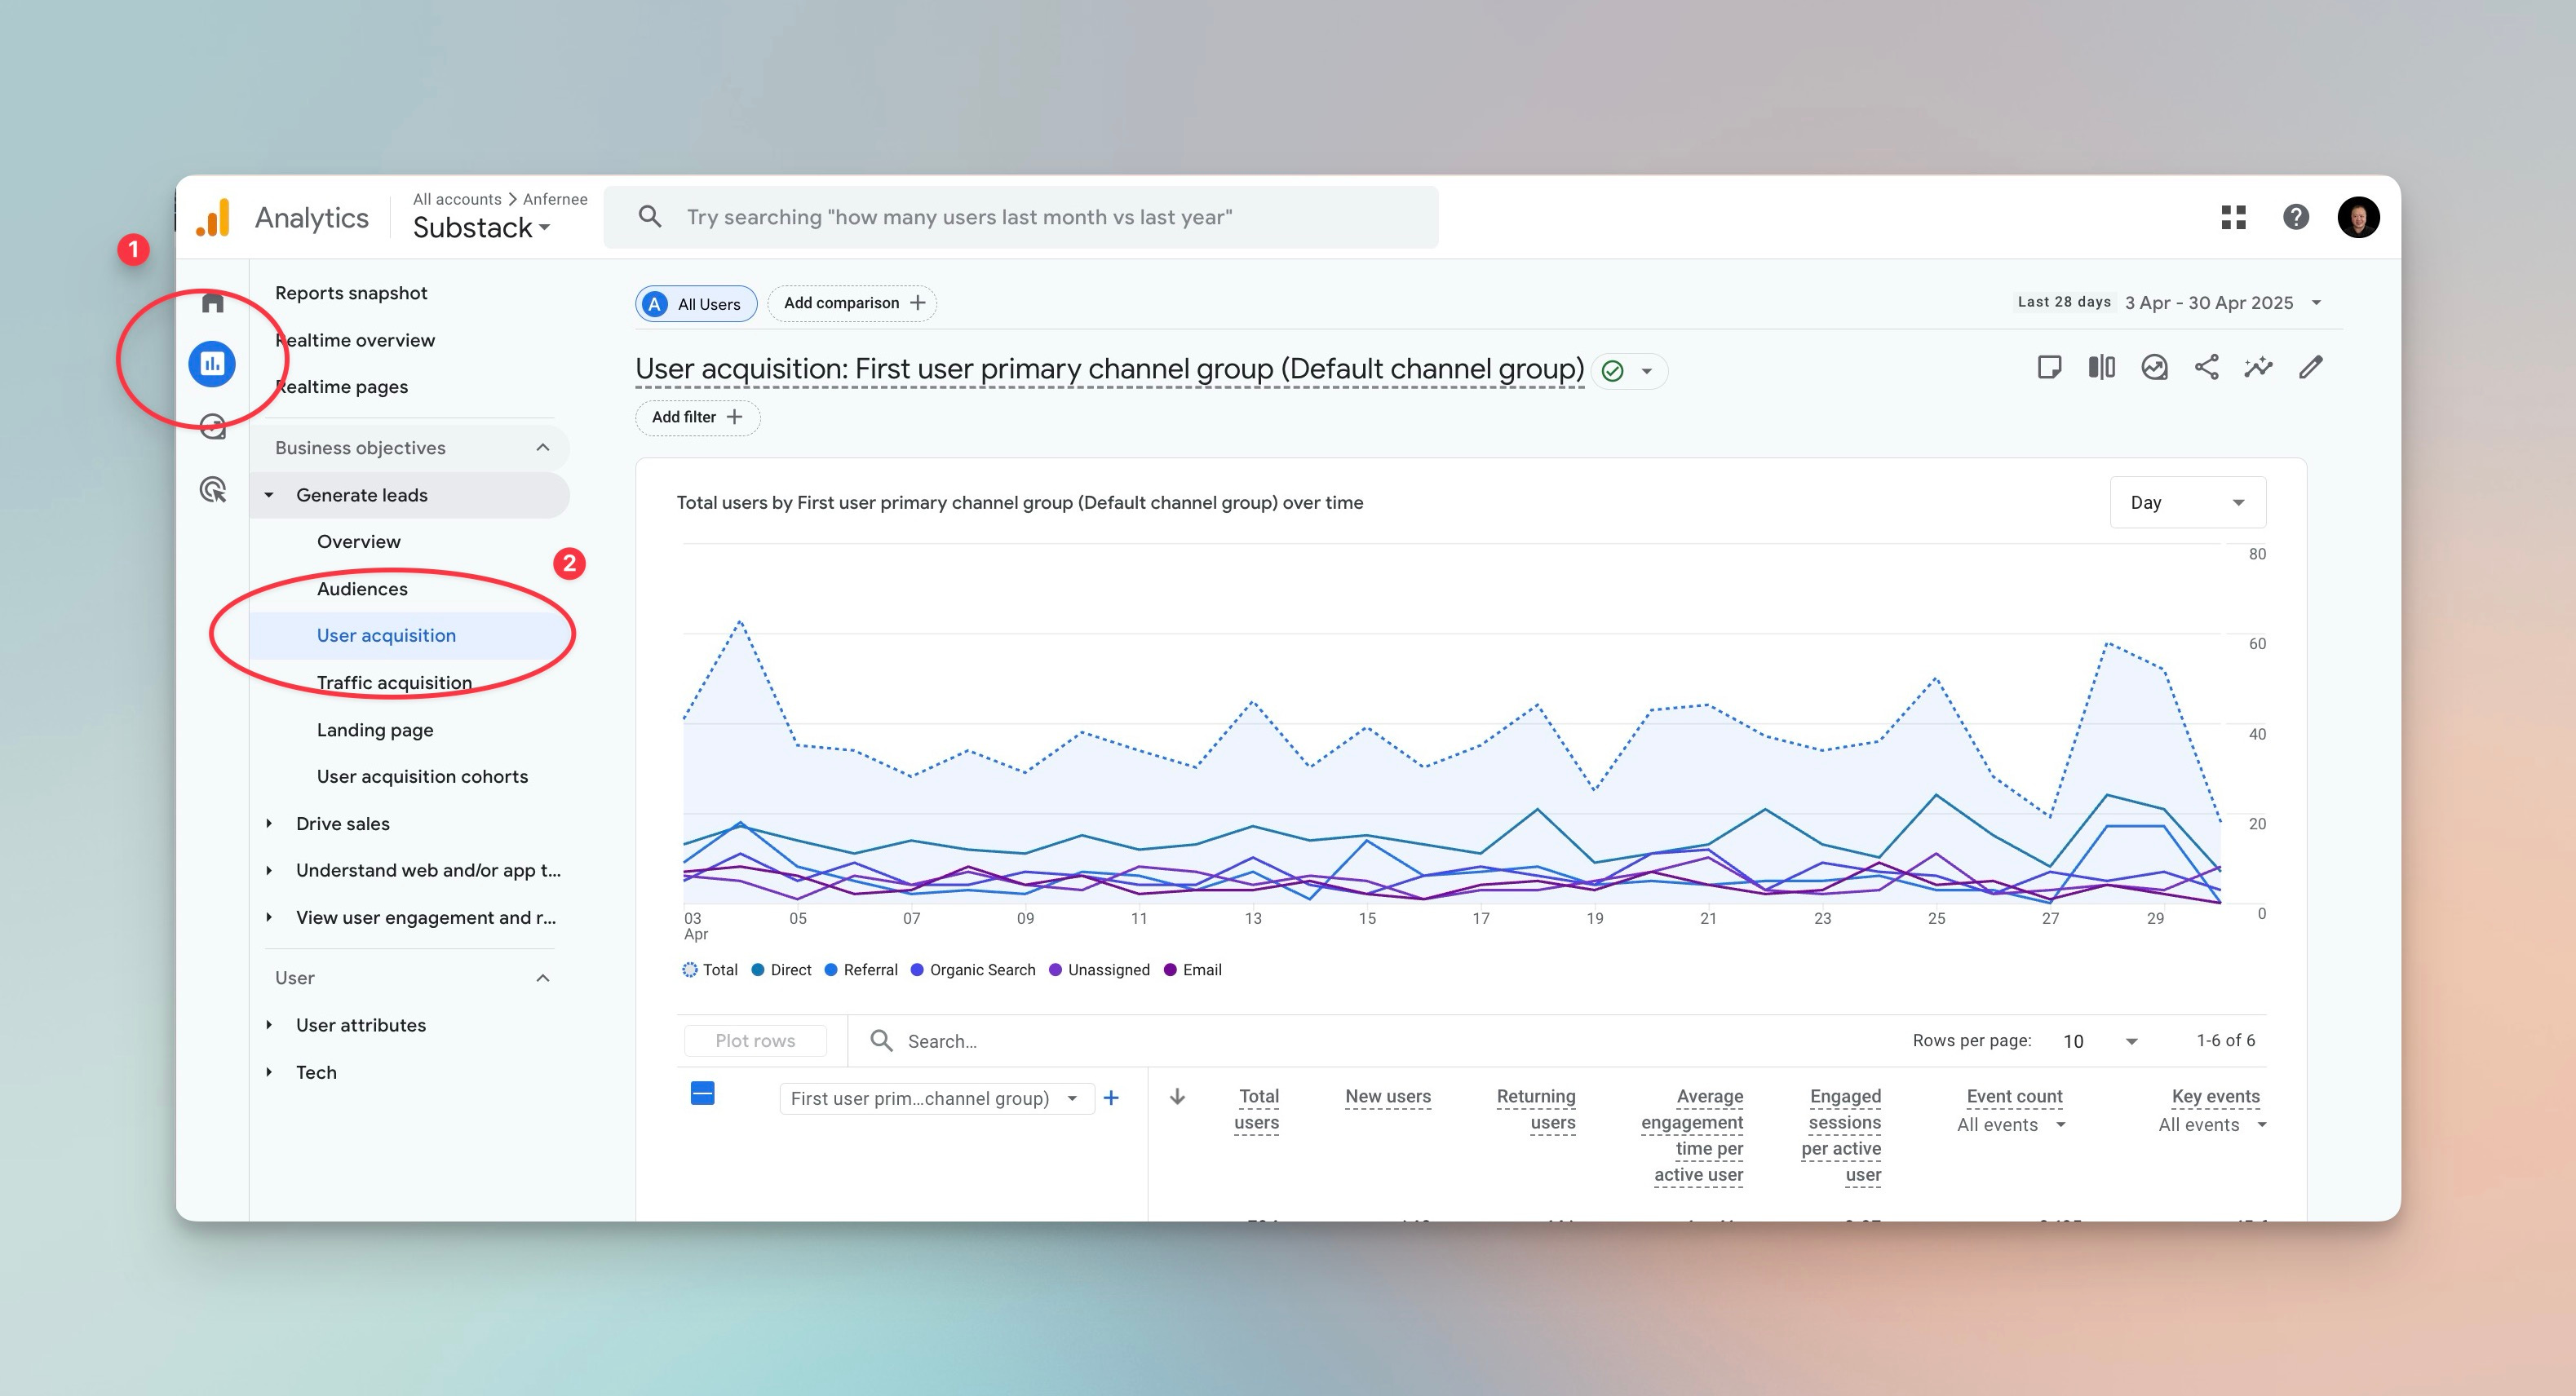
Reports > User Acquisition
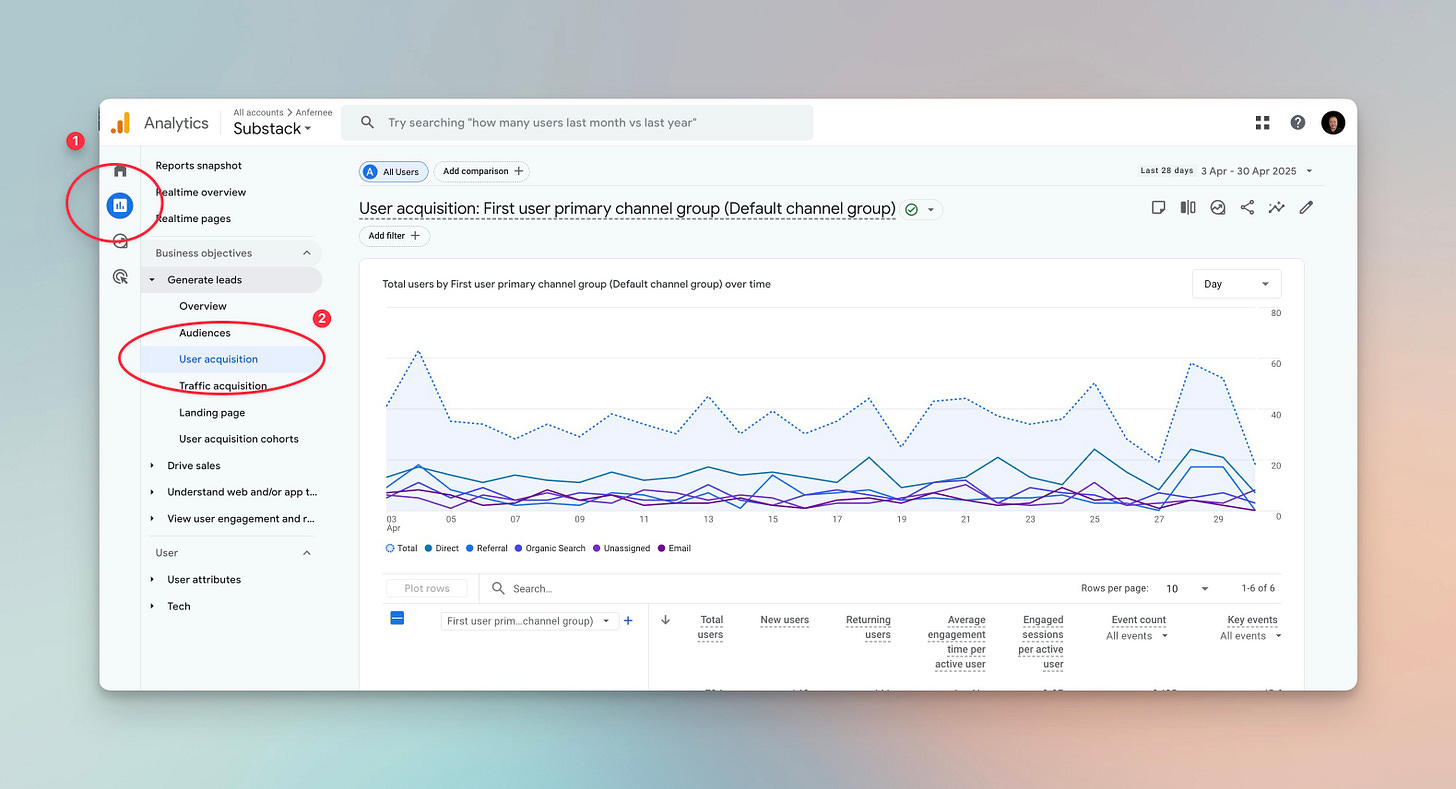
See where your traffic comes from (Twitter, Threads, Google, etc.)
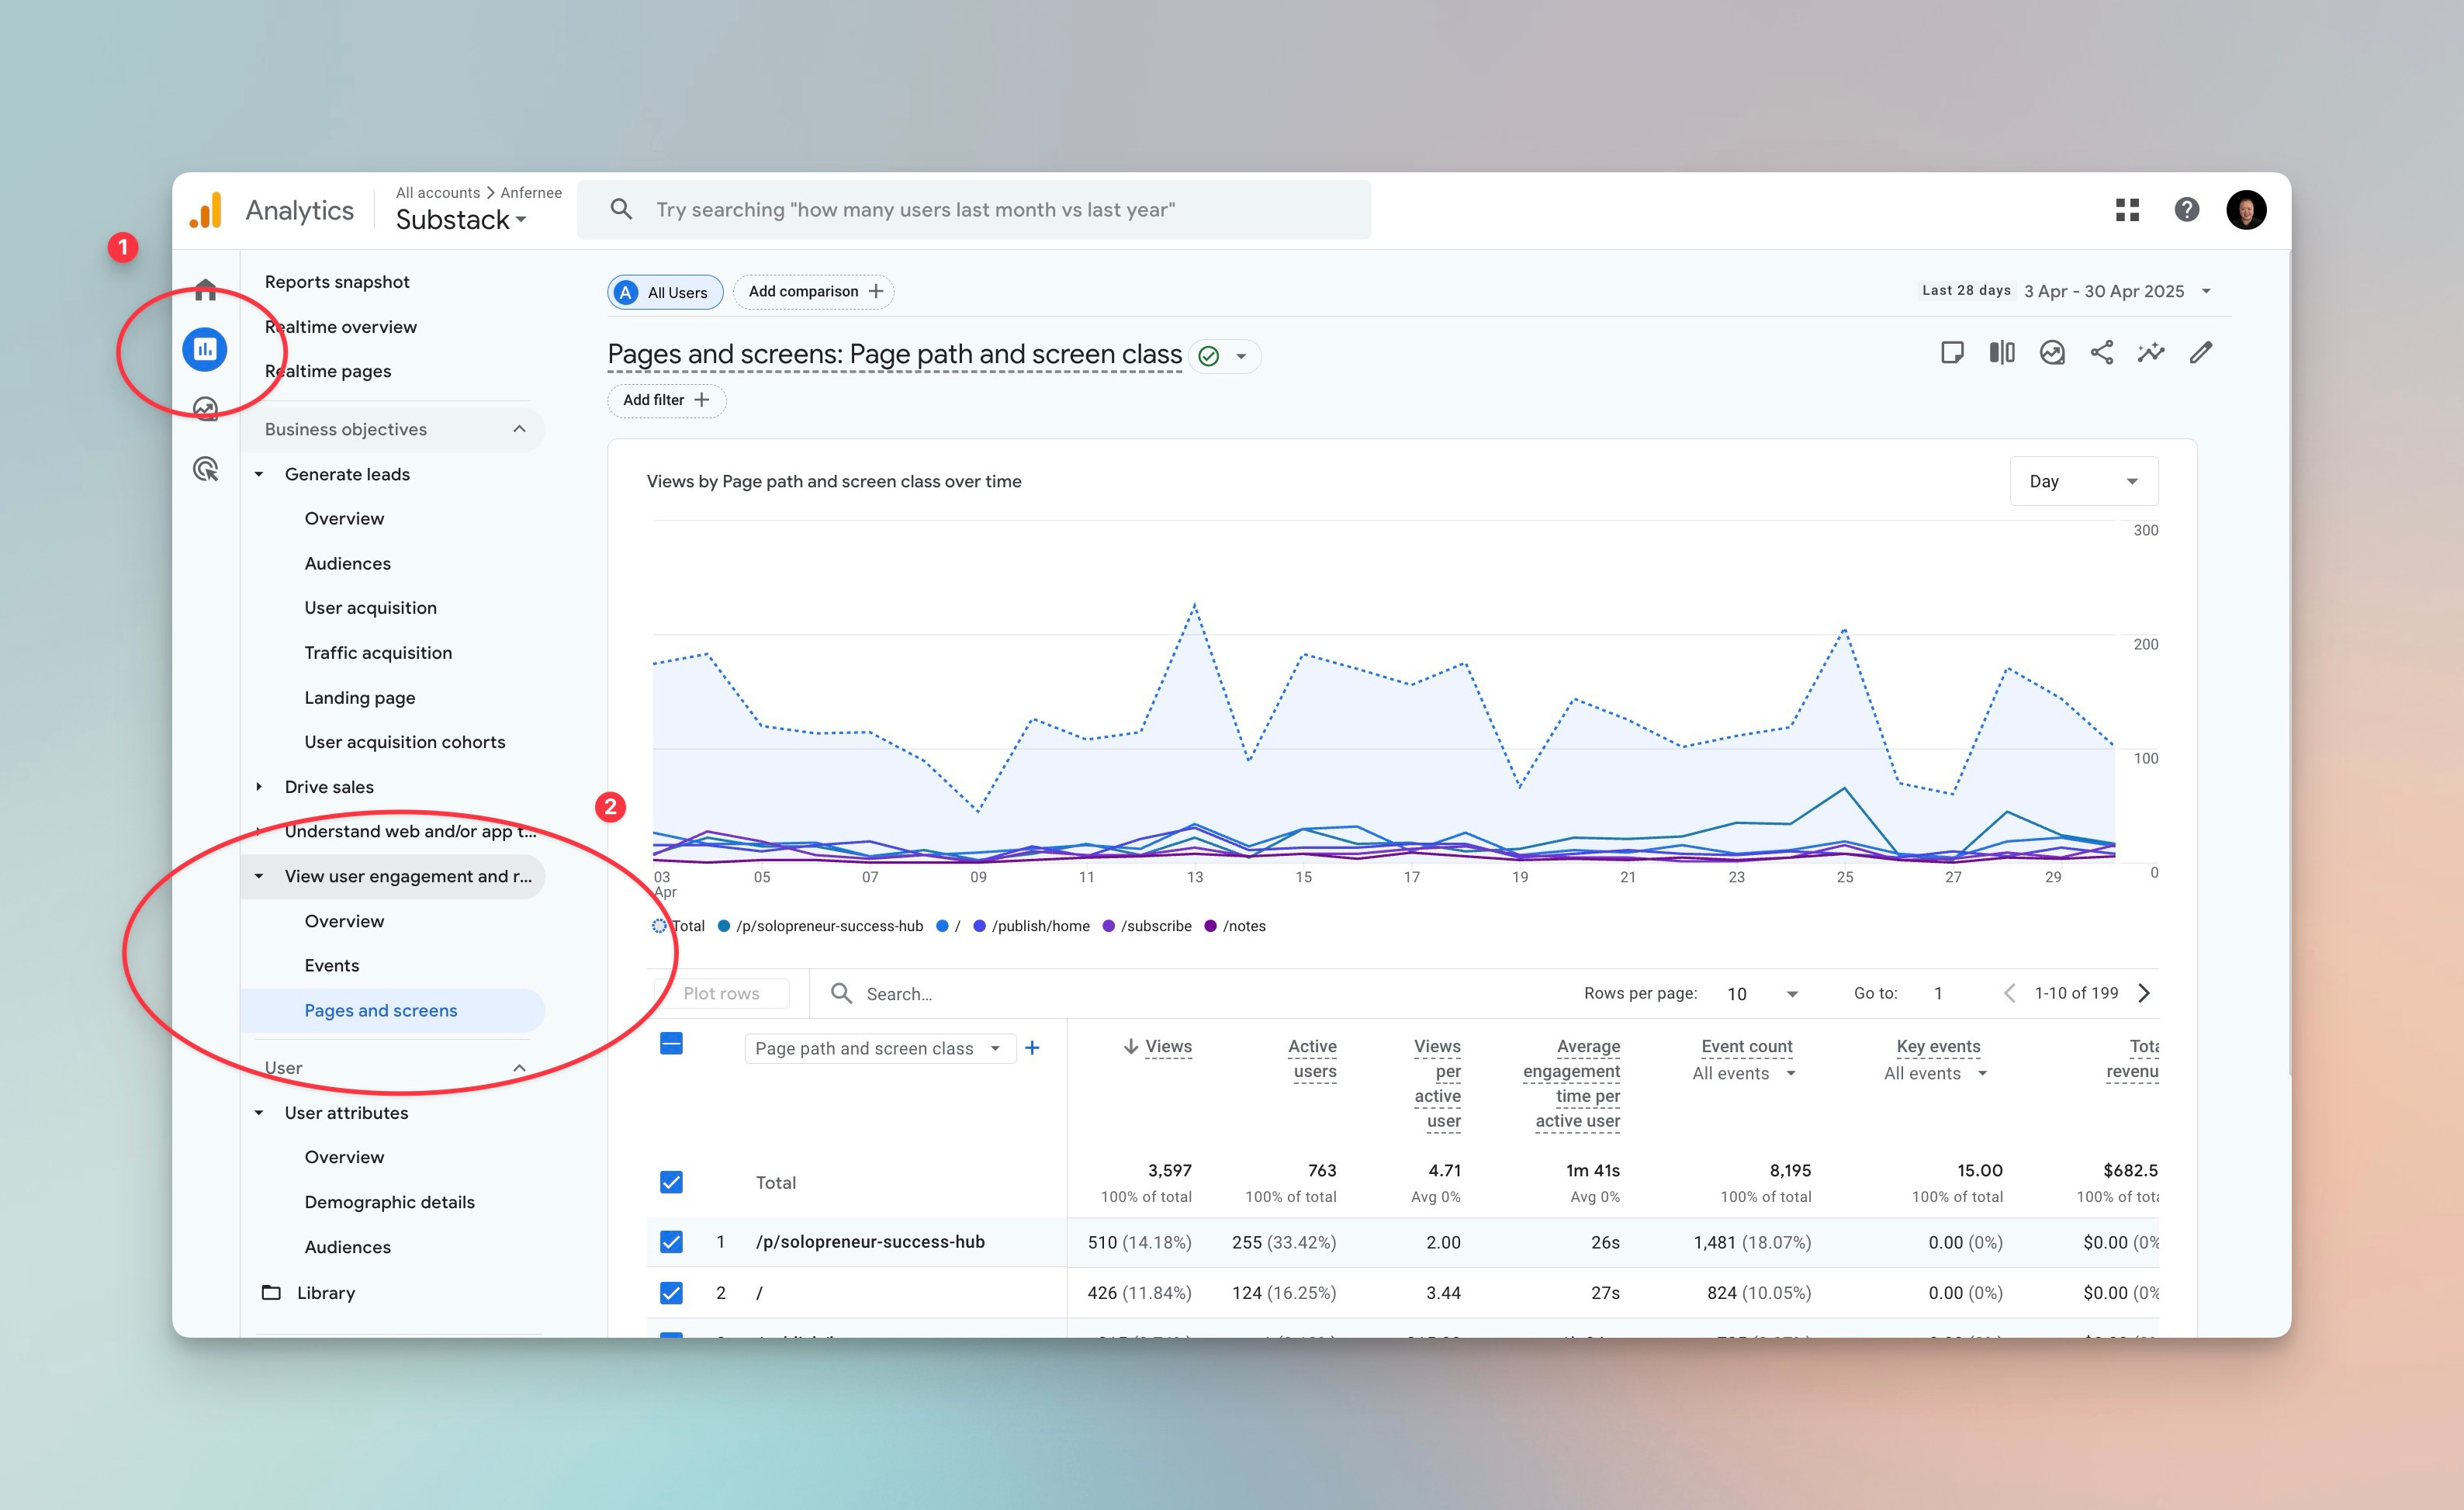
Reports > View User Engagement > Pages and Screens
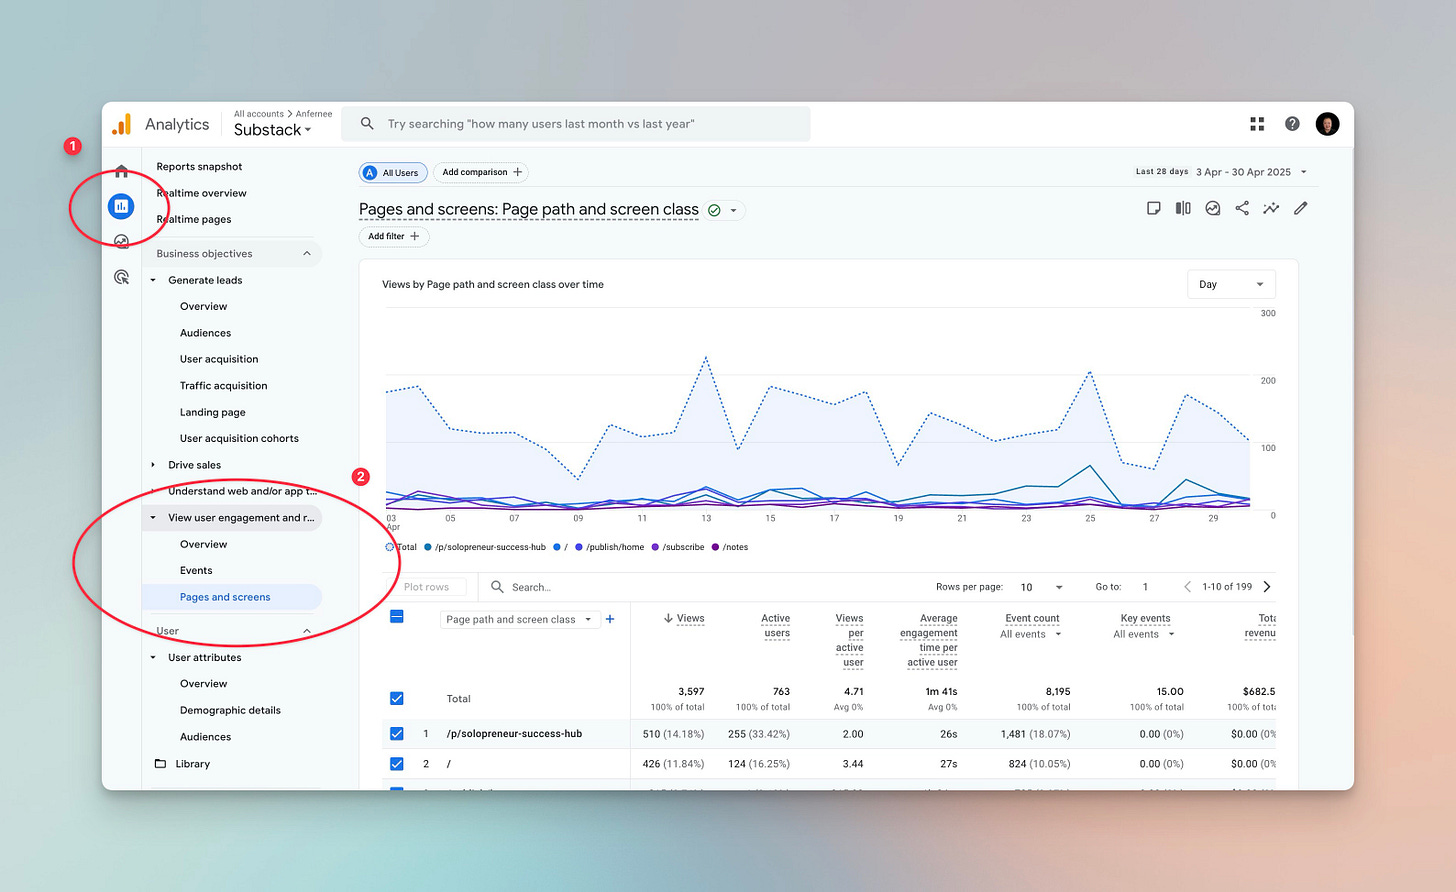
Find out which Substack posts get the most views and attention
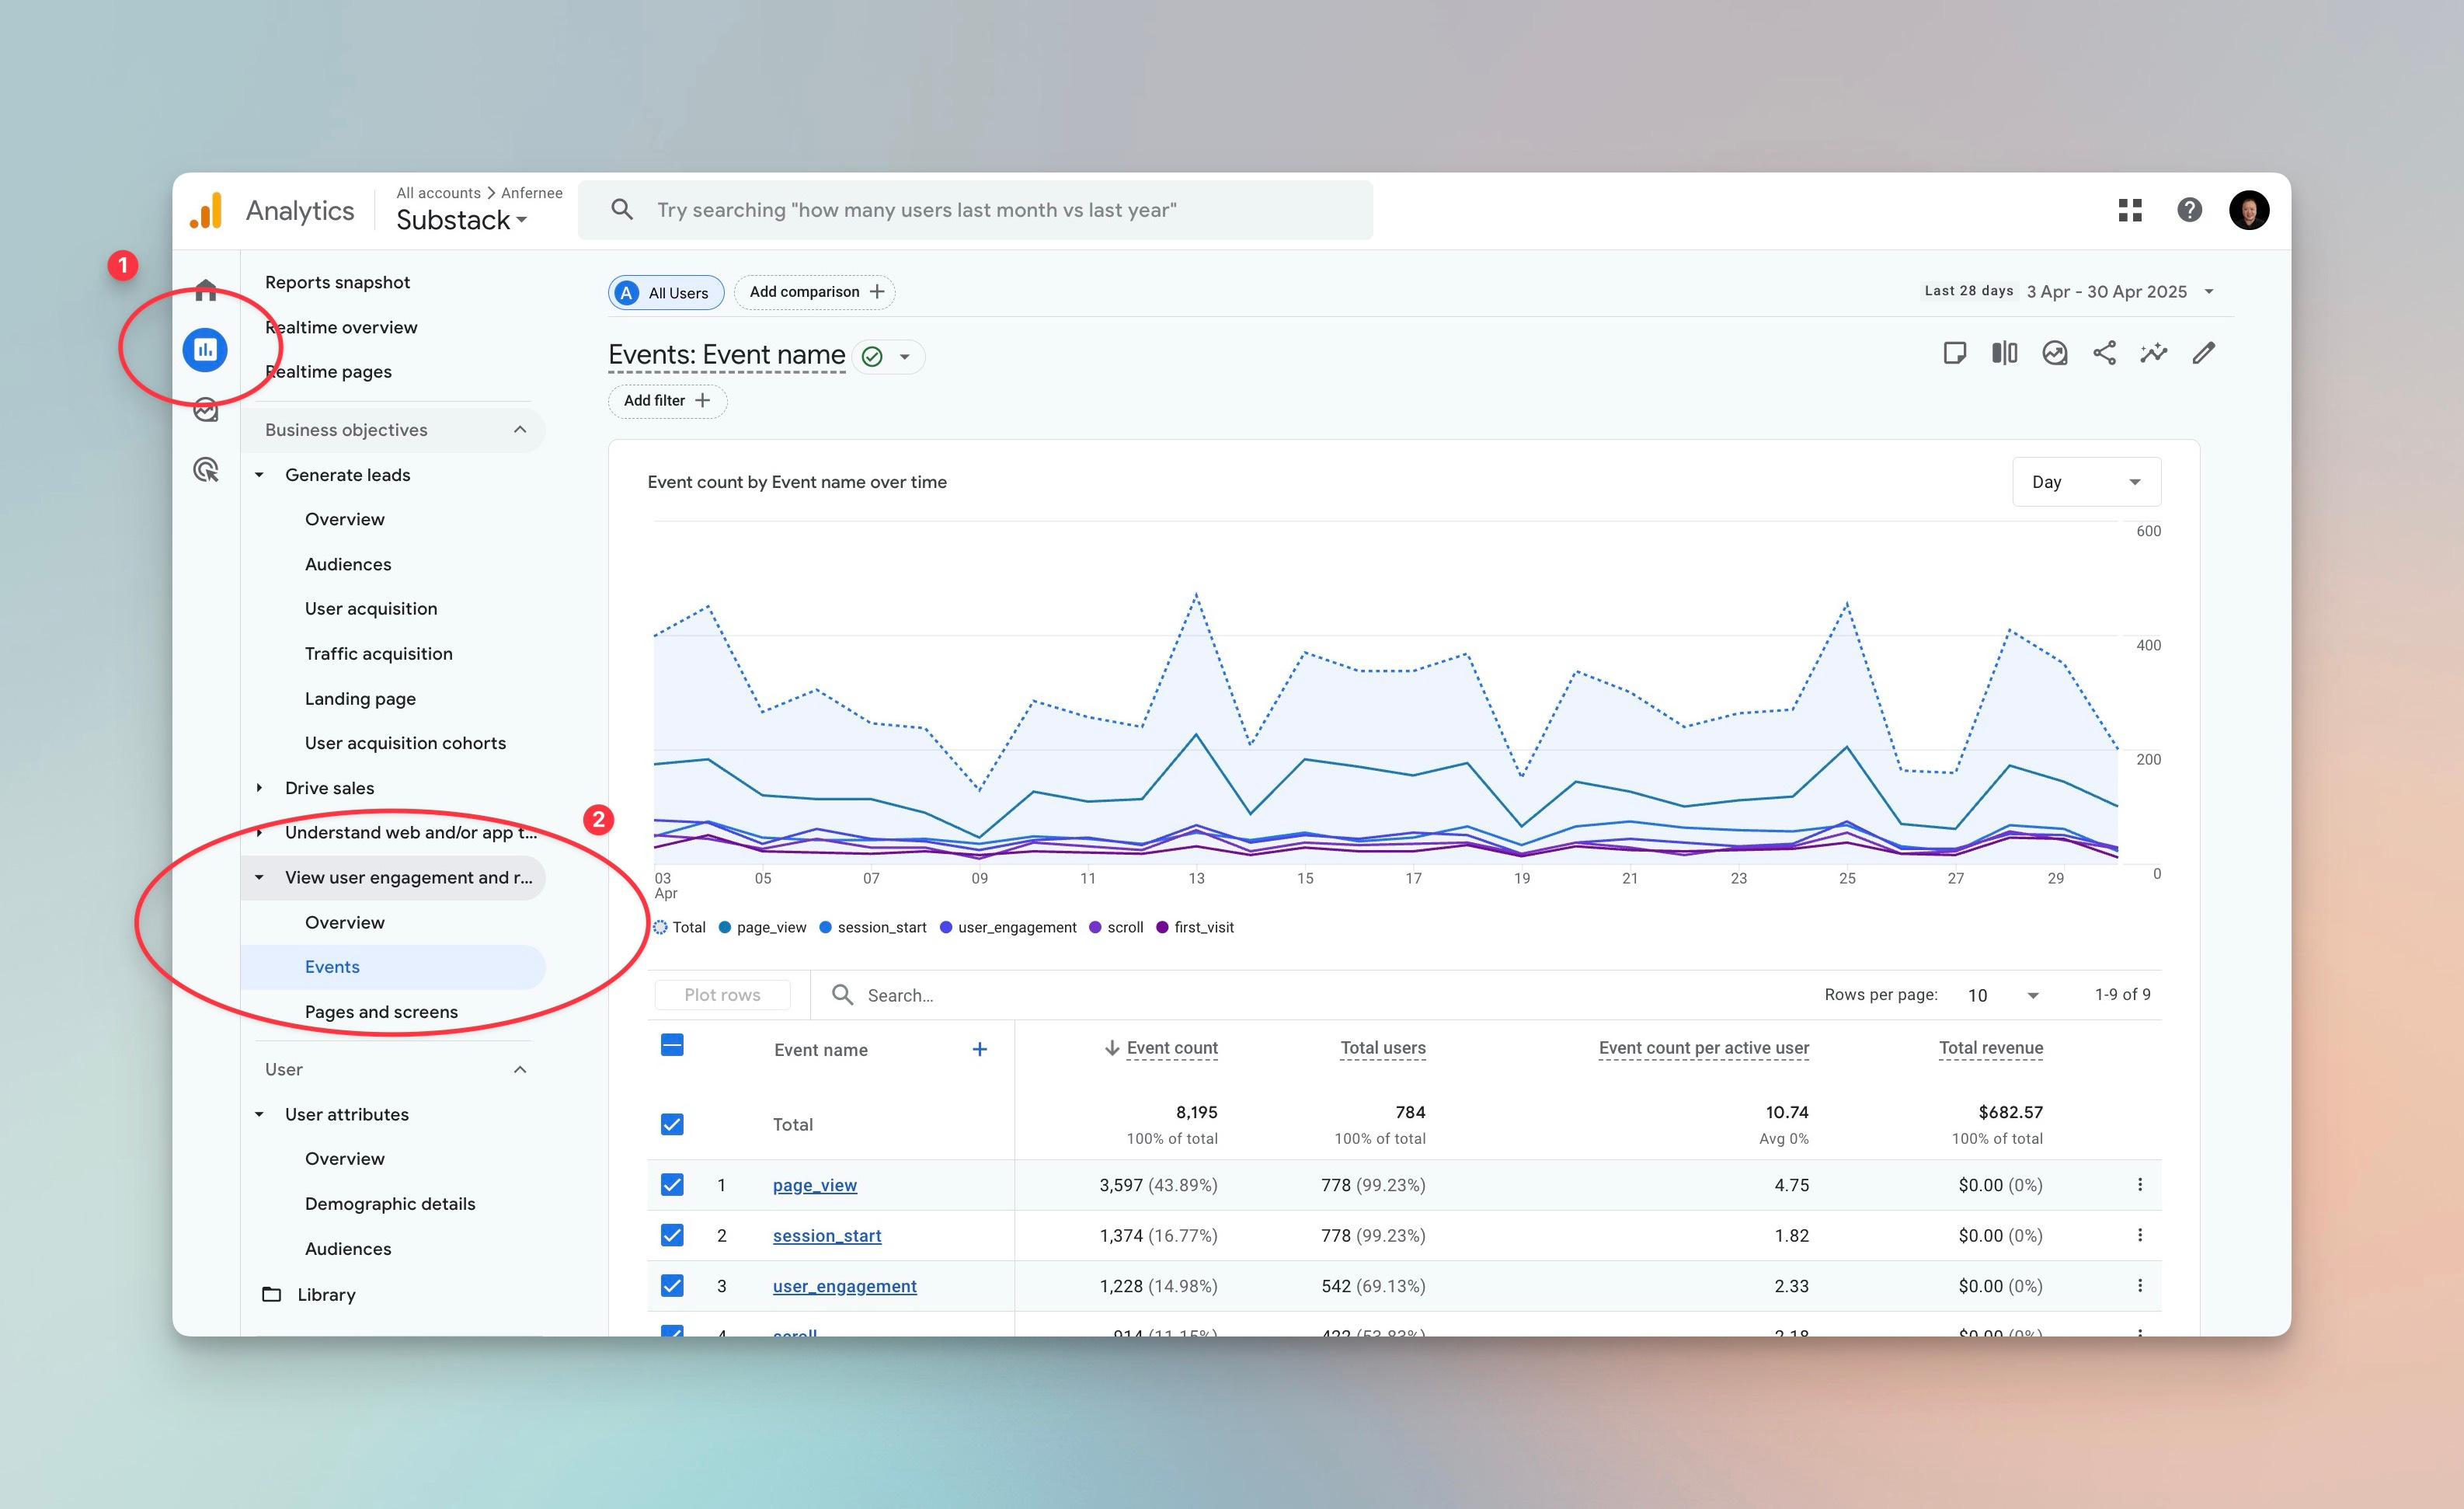
Reports > View User Engagement > Events

Track clicks, scrolls, subscriptions (if you set up custom events)
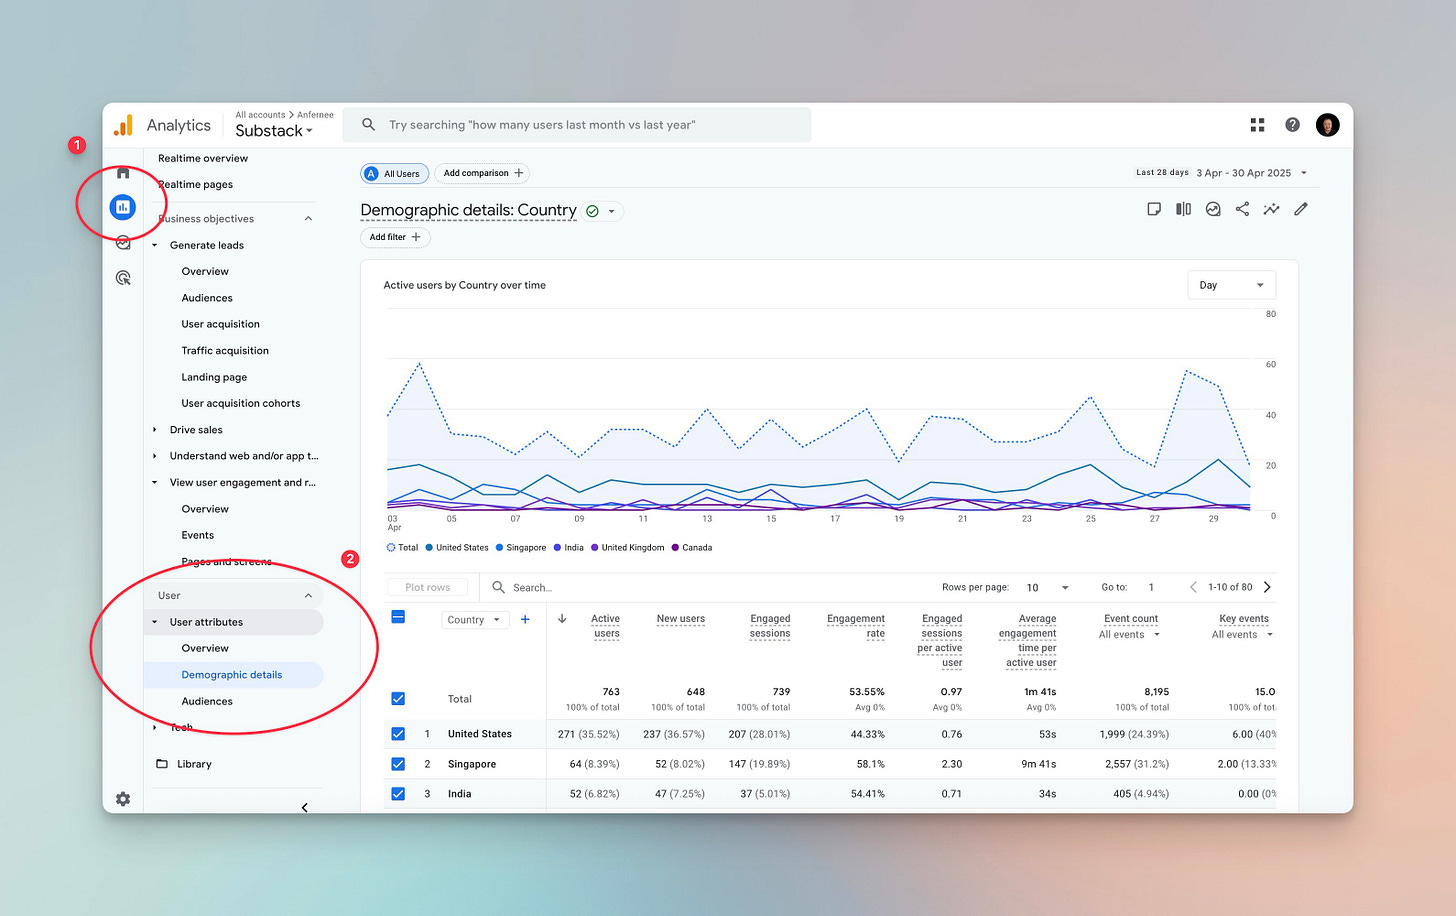
Reports > User Attributes > Demographics Details
Learn what countries, region and languages your readers use. You can even explore age, gender and interest!
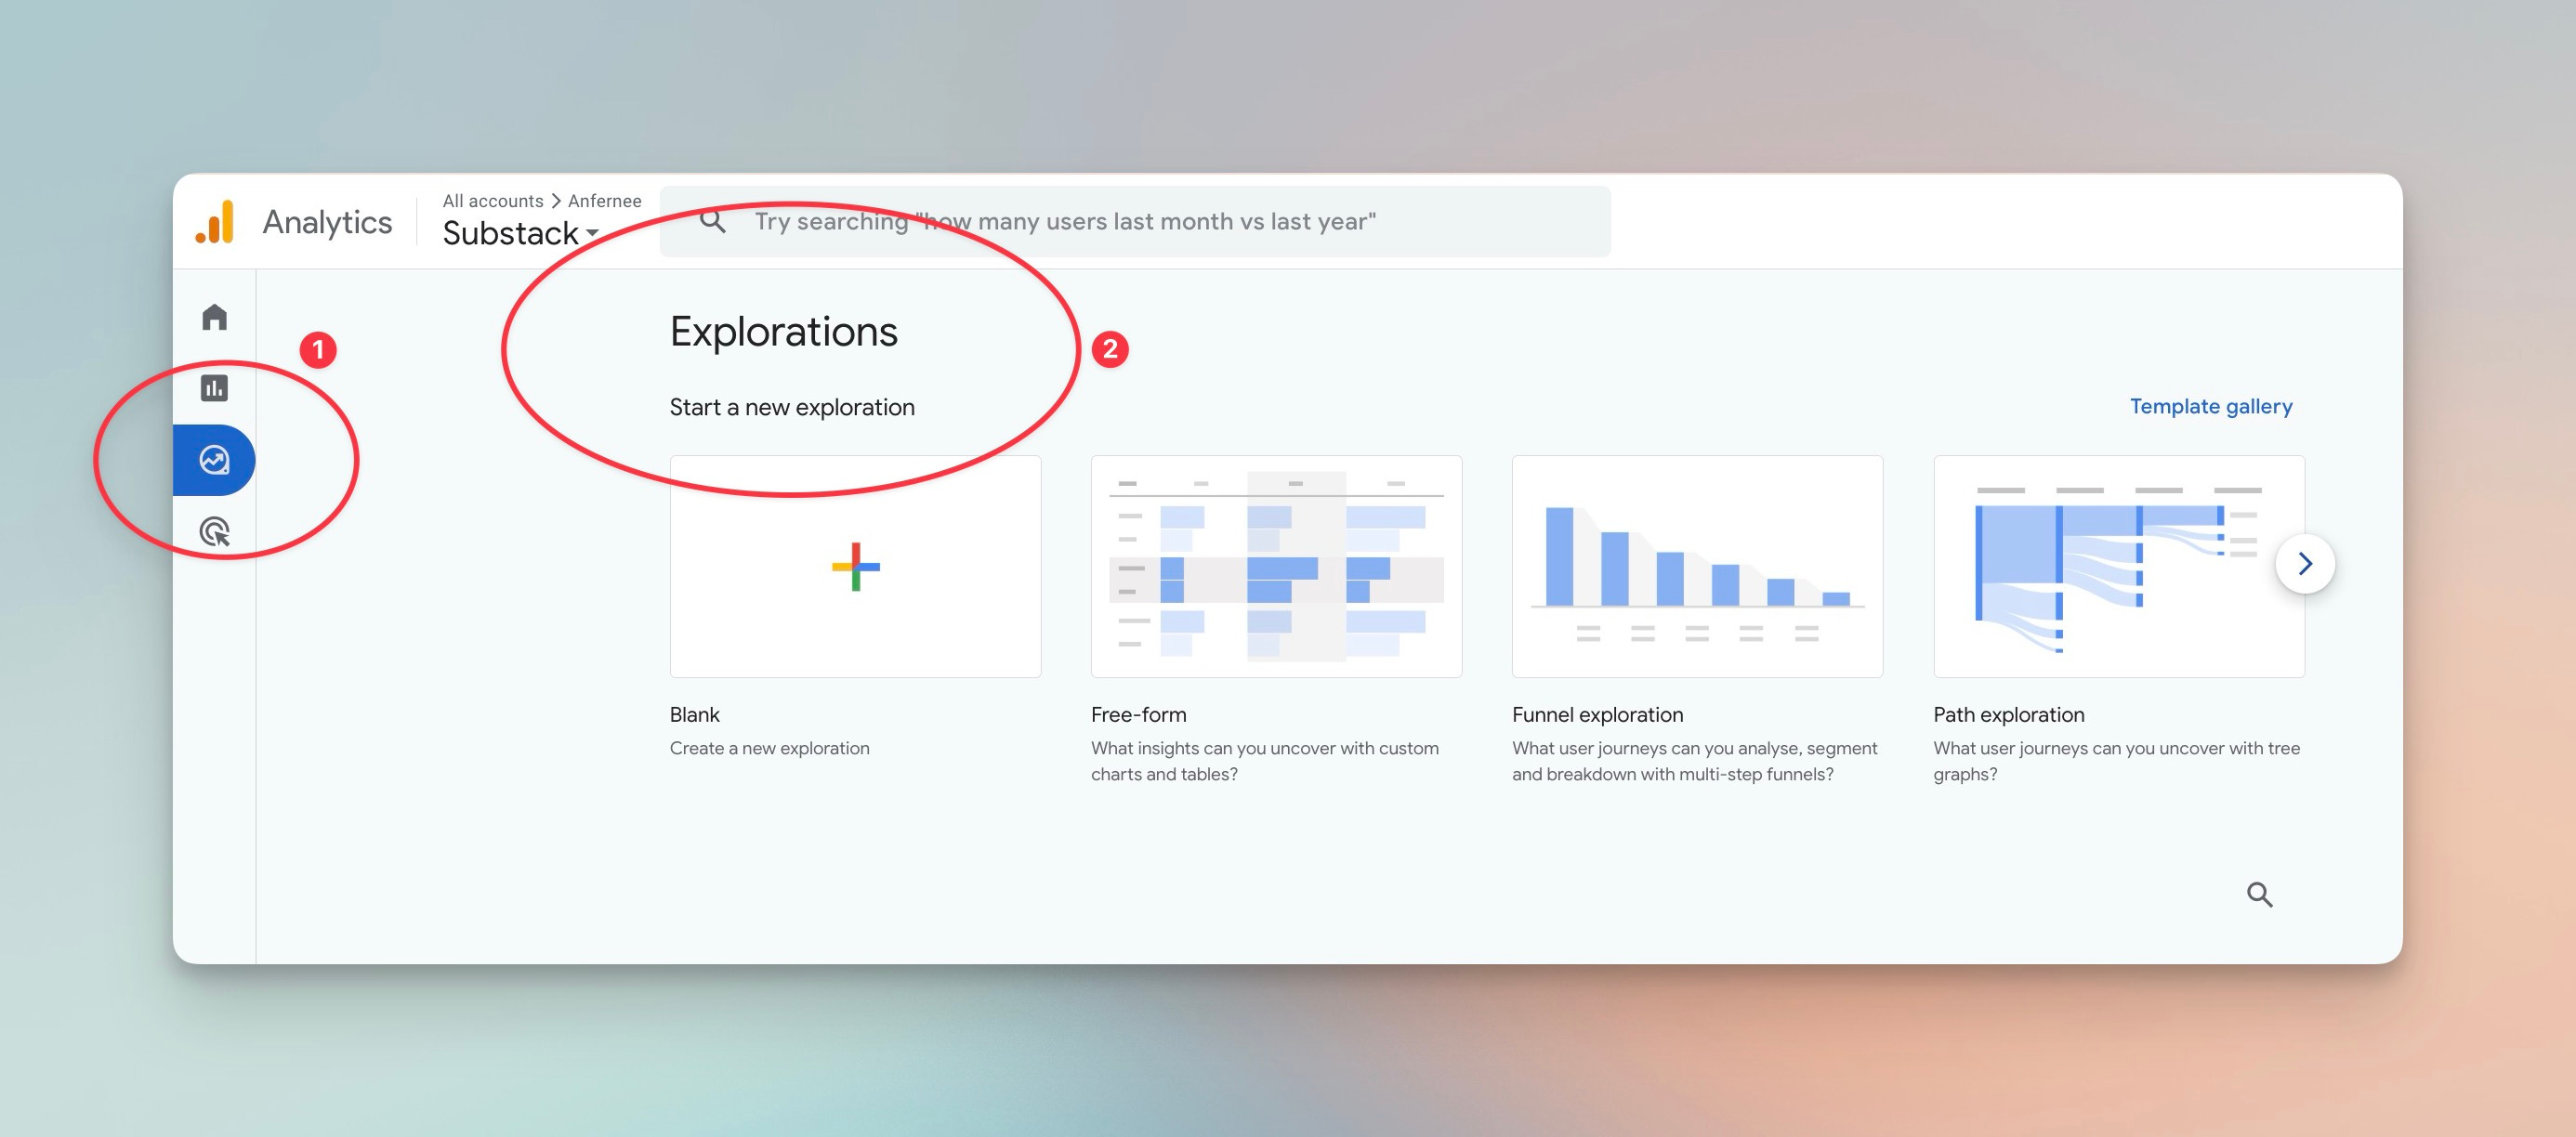
Explore (optional)

Create advanced funnels, insights or custom dashboards if you’re feeling fancy

💡 Pro tip: Pick just one area per week to explore. Don’t try to master GA4 overnight.
4. Key Metrics That Matter (and What to Do with Them)
Here’s a breakdown of the most valuable metrics — and why they matter for growth:
User Acquisition
Where are your readers coming from?
Social? SEO? Referrals?
Action Step: If Threads brings 60% of your readers, focus your promo efforts there.
Users vs Sessions
Users = individual people
Sessions = total visits (including repeats)
Action Step: If sessions are high but users are low, you’re retaining readers well. If it’s the opposite, work on keeping new readers around.
Engagement
Average time spent on page
Engagement rate
Engaged sessions (sessions with meaningful interactions)
Action Step: Spot which posts hold attention and use that style more often.
Conversions (Custom Events)
Set up goals for clicks on:
Subscribe buttons
External links
Product pages or lead magnets
Action Step: Find out what really gets people to act and do more of it.
Top Content
Which posts get the most traffic and engagement?
Action Step: Repurpose your best-performing posts into threads, carousels, or YouTube videos.
Audience & Devices
Mobile vs desktop
Country, city, language
Action Step: Format more for mobile if that’s where most readers are. Also, use location insights to post at the right time.
5. How to Use This Data to Grow Your Substack
Now that you’ve got data, here’s how to use it to make better decisions:
✅ Promote smarter: Invest in your top 1–2 traffic channels
🧠 Test content types: Try short vs long posts, or new topics — and see what sticks
🔁 Repurpose winning content: Turn blog posts into newsletters, videos, or downloads
📱 Optimize for mobile: Keep formatting clean and scannable
⏰ Time your posts: Schedule based on when your readers are online (use timezone data)
6. Limitations of GA4 for Substack Users
GA4 is powerful, but not perfect.
This is especially for Substack creators.
Here’s what it won’t do:
❌ No email open or click tracking
❌ No app engagement data
❌ No built-in conversions — you have to create custom events manually
Full Breakdown - Differences Between GA4 and Substack's Internal Analytics
Google Analytics 4 (GA4) and Substack’s internal analytics both provide valuable insights for newsletter publishers, but they differ significantly in scope, focus, and capabilities.
Scope and Data Collection
GA4:
Tracks website-based interactions, including pageviews, user sessions, traffic sources, user demographics, and engagement metrics for visitors to your Substack web pages.
Data is collected via tracking code embedded on your Substack site, meaning it only captures activity that happens on the web version of your newsletter.
Does not track user behavior within the Substack app or email opens/clicks directly, as those are outside the web browser context.
Substack Analytics:
Focuses on newsletter-specific metrics, including email opens, read rates, subscriber growth, paid conversion rates, and engagement within the Substack ecosystem (such as comments and Notes).
Tracks activity across web, email, and the Substack app, giving a more complete picture of subscriber interactions with your content.
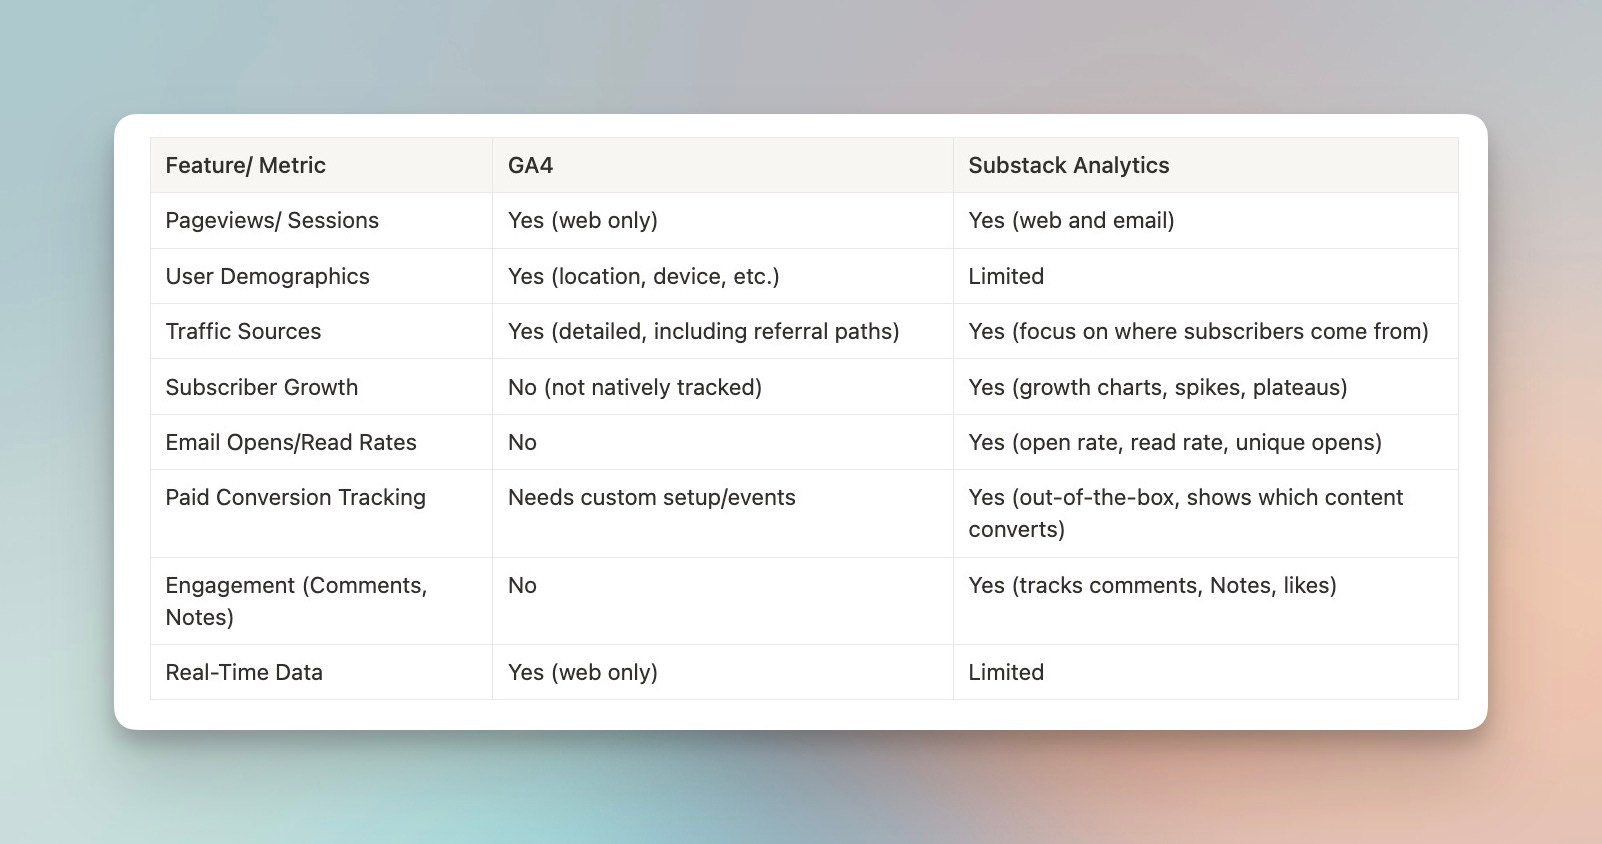
Metrics and Insights
Analysis and Customization
GA4:
Highly customizable: set up custom events, build funnels, and analyze user journeys.
Provides advanced segmentation, cohort analysis, and allows integration with other Google tools.
Requires more technical setup and interpretation.
Substack Analytics:
Simple, newsletter-focused dashboard with actionable metrics for writers.
Designed for ease of use, with less customization but more direct relevance to newsletter growth and engagement.
Surfaces insights like best-performing content, optimal send times, and subscriber acquisition sources.
Why These Differences Matter
GA4 is best for understanding how people discover and interact with your Substack on the web, optimizing your site for SEO, and analyzing traffic patterns from external sources.
Substack Analytics is essential for tracking email performance, subscriber engagement, and paid conversion-core drivers of newsletter growth and revenue.
Using both in tandem gives you a holistic view: GA4 for web analytics and audience acquisition, Substack analytics for email and subscriber lifecycle management.
So what’s the fix?
➡️ Use GA4 with Substack’s native analytics, not instead of them.
Let Substack handle the email side. Let GA4 handle the web behavior.
7. Use Data to Write Smarter, Not Harder
Look, you don’t need to be a data wizard to benefit from GA4.
But by tracking just a few key metrics, you can:
Learn what content your audience loves
Promote in the right places
Grow your newsletter without burning out
So here’s your to-do list for this week:
✅ Connect GA4 to your Substack
✅ Pick one metric to track for the next 7 days
✅ Reflect, adjust, repeat
Start small. Stay curious. Let your data guide better decisions.
8. FAQs
Q1: Can I use GA4 if I don’t have a custom domain on Substack?
Yes! You can still use your default Substack URL (like yourname.substack.com) when setting up GA4.
Q2: Does GA4 track people who read my newsletter in their inbox?
No. GA4 only tracks web-based behavior. Use Substack’s built-in analytics for email data.
Q3: Can I track when people click my “Subscribe” button?
Yes, but you’ll need to set up a custom event using Google Tag Manager or similar tools.
Q4: Is GA4 free to use?
Totally free (that’s why I highly recommend it). All you need is a Google account.
9. Enhance Your Substack Growth: How to Use ChatGPT to Analyze GA4 Data
Now that you’ve connected Google Analytics 4 (GA4) and started poking around those juicy metrics… you might be thinking:
“Okay, I see numbers — but now what?”
I present to you: AI-powered analysis.
Yep, ChatGPT (or your favorite AI tool) isn’t just for writing posts or brainstorming headlines.
You can actually feed it your GA4 data and let it do the heavy lifting on analysis, trend spotting, and content strategy planning.
Let’s dive into how to use AI to go from data overload to actionable insight in minutes:
I will go through the following:
🧠 Detailed Prompt for: General Understanding of GA4 Metrics with ChatGPT
📊 Detailed Prompt for: Data Interpretation of GA4 Metrics with ChatGPT
🎯 Detailed Prompt for: Action Planning Based on GA4 Data with ChatGPT
📌 Detailed Prompt for: Content Strategy Based on GA4 Data with ChatGPT
🧰 Prompt Library for Analyzing GA4 Data with ChatGPT
Whether you’re staring at a messy report or scratching your head over why April’s numbers dipped, these copy-and-paste prompts will help ChatGPT break down your GA4 data like a friendly data nerd sidekick.
📌 Pro Tip: Keep this prompt library in a Notion doc or Google Sheet. You’ll refer to it every time you publish a newsletter or run a campaign.
🧠 Detailed Prompt for: General Understanding of GA4 Metrics with ChatGPT
If you’re new to Google Analytics 4 (GA4), some of the terminology can feel like a foreign language. That’s exactly why the “General Understanding” prompt category exists — to help you (or your team) break things down in plain English and understand how each metric actually impacts your Substack newsletter performance.
Below is a fully detailed and customizable prompt that you can use with ChatGPT or any AI tool to learn what a metric means and why it matters to your content strategy.
Prompt Template: “Explain [Metric] and Its Newsletter Impact”
I'm using Google Analytics 4 (GA4) to track my Substack newsletter website. I'm trying to better understand a specific metric: [Insert GA4 Metric].

Please explain this metric in plain, simple language — like you're talking to someone who has no background in analytics.

Also, explain:
- How this metric applies specifically to a content-based newsletter like mine
- What a “good” number typically looks like for this metric
- What it might indicate if the number is too high or too low
- How it impacts newsletter growth, reader engagement, or conversions
- What specific actions I could take if this metric improves or worsens

Optional: If you can, give an example using imaginary data.

Here’s a little context about my content:
- I publish 2 newsletters per week, focused on [insert topic]
- My audience mainly comes from [insert top channels like Twitter, SEO, email]
- I want to grow my readership and keep engagement high
Example: Explaining “Engagement Rate”
I'm using Google Analytics 4 (GA4) to track my Substack newsletter website. I'm trying to better understand a specific metric: [Engagement Rate].

Please explain this metric in plain, simple language — like you're talking to someone who has no background in analytics.

Also, explain:
- How this metric applies specifically to a content-based newsletter like mine
- What a “good” number typically looks like for this metric
- What it might indicate if the number is too high or too low
- How it impacts newsletter growth, reader engagement, or conversions
- What specific actions I could take if this metric improves or worsens

Here’s a little context about my content:
- I publish 2 newsletters per week, focused on productivity tips for remote workers
- My audience mainly comes from Twitter and direct email
- I want to grow my readership and keep engagement high
ChatGPT might respond with:
Engagement Rate in GA4 is the percentage of sessions that were considered “engaged.” A session is engaged if a visitor stayed on your site for 10 seconds or longer, viewed 2 or more pages, or triggered a meaningful event (like clicking a link).
For a newsletter site, this metric tells you how much attention your readers are giving to your web-based posts. A good engagement rate is often above 60%, but it depends on your content type and audience.
If your engagement rate is low, it might mean:
Visitors aren’t finding the content relevant or useful
The layout is hard to read on mobile
Your headlines are stronger than the actual post content
If it’s high, you’re doing a great job at keeping people interested — and you might want to double down on the topics or formats of those high-performing posts.
Actionable steps if it drops:
Shorten paragraphs and add more visuals
Add clear CTAs mid-way through posts
Use internal links to guide readers to related articles
Bonus: List of Common GA4 Metrics to Plug Into This Prompt
To make this plug-and-play, here are some common GA4 metrics you can swap into the prompt:
Engagement Rate
Average Engagement Time
Sessions
Users vs New Users
Bounce Rate (legacy)
Conversion Rate (for custom goals)
Traffic Source / Medium
Top Landing Pages
Scroll Depth (custom event)
Exit Rate
📊 Detailed Prompt for: Data Interpretation of GA4 Metrics with ChatGPT
This is where things get seriously powerful.
Once you’ve exported your GA4 data, whether it’s traffic channels, landing page performance, engagement rates, or conversion events, ChatGPT can act as your personal data analyst.
It can help you:
Spot patterns or anomalies
Identify what’s working (and what’s not)
Understand where to double down or pivot your content efforts
Here’s your in-depth, plug-and-play prompt to help AI interpret your GA4 data with nuance and insight, tailored specifically for newsletter creators like you.
Prompt Template: “Interpret This GA4 Data and Extract Key Insights”
I’m a newsletter creator using Google Analytics 4 (GA4) to track the performance of my Substack website. Below is a summary of my GA4 data for the past 30 days.

[Insert GA4 table or summary here — or describe key stats such as traffic sources, engagement time, top pages, conversions, etc.]

Please analyze this data and help me understand:
- What trends, patterns, or anomalies you see
- Which traffic sources are performing best (in terms of both quantity and quality)
- Which pages or posts are the strongest performers — and why that might be
- What this data tells me about my audience’s preferences or behavior
- Any red flags, drop-offs, or underperforming areas I should be aware of
- What specific next steps I should take based on this data (e.g., content ideas, promotional strategies, posting schedule)

Here’s some context about my newsletter and goals:
- I publish [number] issues per week about [insert niche/topic]
- My primary growth goals are [e.g., more subscribers, higher engagement, content repurposing]
- My top promotional channels are [e.g., Twitter, LinkedIn, email referrals, SEO]
- I want to increase [e.g., engagement time, conversion rate, traffic from search]

Optional: Recommend 1–2 new experiments or optimizations I should test in the next 30 days.
Example Prompt with Data
I’m a newsletter creator using GA4 to track performance. Here's a snapshot of my past 30 days:

Traffic Sources:
- Direct: 2,100 users | Avg. engagement time: 1:35
- Twitter: 1,800 users | Avg. engagement time: 2:45
- Google Search: 700 users | Avg. engagement time: 3:10
- LinkedIn: 420 users | Avg. engagement time: 0:55

Top Pages:
- /productivity-myths-busted: 2,200 views | 3:20 avg. time | 18 conversions
- /ai-tools-review: 1,400 views | 2:05 avg. time | 9 conversions
- /morning-routine-guide: 800 views | 3:00 avg. time | 7 conversions

Please interpret this data and help me understand:
- What traffic source is giving me the best ROI?
- What type of content is resonating most?
- Why might LinkedIn be underperforming?
- What topics should I explore more based on user interest?
- What should I prioritize next month?
My goal is to grow subscribers and increase engagement.
What ChatGPT Might Return
Twitter and Google Search are giving you the most engaged traffic. Google Search has the highest average engagement time, suggesting that people who find you via SEO are highly interested in your content. Twitter brings quantity + solid engagement.
The /productivity-myths-busted post is performing best across all KPIs, indicating a strong interest in myth-busting or contrarian takes. Consider creating similar posts (e.g., “Biggest Time Management Lies”).
LinkedIn is likely underperforming due to either a mismatch in content format or headline style that doesn’t click with a professional audience. Consider A/B testing headlines or repurposing top-performing Twitter threads for LinkedIn posts.
Next month, focus on:
Boosting SEO-optimized posts
Repurposing “myth-busting” content into tweets and reels
Testing more evergreen topics (like “daily habits,” “routines”)
Bonus: Try improving your LinkedIn presence by posting at different times and engaging more in comments.
Additional Prompt Variations You Can Use
🔸 Traffic Sources Deep Dive
Based on this GA4 breakdown of traffic sources, tell me which channels are sending the most valuable users — and which are worth investing more in.Audience Behavior Summary
Here’s my engagement data and top content. What does this tell you about my audience's interests, reading habits, or content preferences?Strategic Recommendations
Based on the following data, what 2 content experiments and 1 promotional test should I run next month to improve conversions and engagement?Format Tips When Sending Data to ChatGPT
Keep data tables clean and labeled (or describe them in list form)
If copying screenshots, provide a brief text summary too
Focus on one core question per prompt for deeper insights
Add personal context (topic, goals, audience) so AI gives tailored advice
Remember: Data ≠ insight.
But data + AI = stories, strategies, and smarter decisions.
Instead of drowning in metrics, you can now ask better questions, uncover trends faster, and take action that actually moves the needle.
🎯 Detailed Prompt for: Action Planning Based on GA4 Data with ChatGPT
You’ve pulled your GA4 reports. You’ve spotted your high-performing posts, your top traffic sources, and your bounce-worthy pages.
Now comes the critical step: turning insights into actions.
This is where AI (like ChatGPT) can become your mini growth strategist, helping you translate metrics into concrete moves from improving engagement time to optimizing conversions and repurposing killer content.
The following in-depth prompt is designed to help you extract actionable, strategic next steps based on your GA4 performance data.
Prompt Template: “What Should I Do Based on This GA4 Report?”
Keep reading with a 7-day free trial
Subscribe to The Solopreneur Code to keep reading this post and get 7 days of free access to the full post archives.